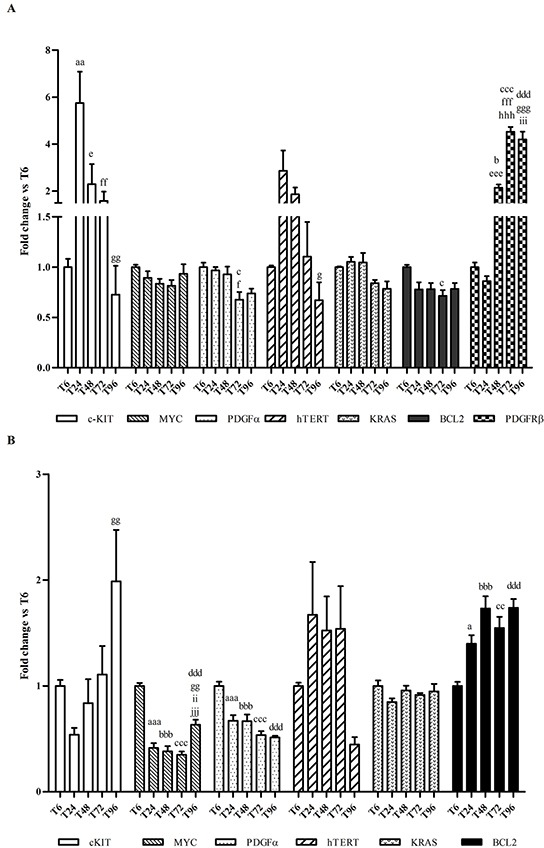
Figure 6. Effects of culturing time on gene expression.

A. Total RNA was isolated from HGC27 monolayers and mRNA levels of c-KIT, MYC, PDGFA, hTERT, KRAS, BCL2 and PDGFRβ were measured by using a qPCR approach. B. Total RNA was isolated from MCF7 monolayers and mRNA levels of c-KIT, MYC, PDGFA, hTERT, KRAS and BCL2 were measured by using a qPCR approach. Data (arithmetic means ± S.D.) are expressed as n-fold change (arbitrary units, a. u.) normalized to the RQ mean value of cells stopped at T6, to which an arbitrary value of 1 was assigned.a, aa, aaa: P<0.05; P<0.01; P<0.001 T6 vs T24; b, bbb: P<0.05; P<0.001 T6 vs T48; c, cc, ccc: P<0.05; P<0.01; P<0.001 T6 vs T72; ddd: P<0.001 T6 vs T96; e, eee: P<0.05; P<0.001 T24 vs T48; f, ff, fff: P<0.05; P<0.01; P<0.001 T24 vs T72; g, gg, ggg: P<0.05; P<0.01; P<0.001 T24 vs T96; hhh: P<0.001 T48 vs T72; ii, iii: P<0.01; P<0.001 T48 vs T96; jjj: P<0.001 T72 vs T96.
