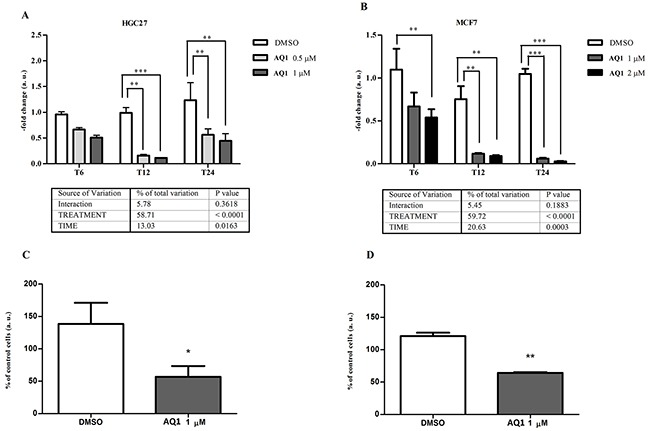
Figure 7. Effect of AQ1 on c-KIT mRNA and protein expression in HGC27 and MCF7 cell lines.

c-KIT mRNA levels panels A-B. were measured using a qPCR assay, and data (arithmetic means ± S.D.) are expressed as n-fold change (arbitrary units, a. u.) normalized to the RQ of control cells at each time of incubation (T6, T12, T24), to which an arbitrary value of 1 was assigned. The two-way ANOVA followed by Bonferroni post-test were used to check for statistical differences between doses and time of treatment. The c-kit protein amount panels C-D. was measured 48 hours post-exposure by flow cytometry, and data are expressed as n-fold change (%) of the mean fluorescence intensity (MFI) measured in untreated cells. The Student t-test was used to measure statistical differences between cells exposed to AQ1 and those treated with the vehicle (DMSO) only.*,**, ***: P<0.05; P<0.01; P<0.001.
