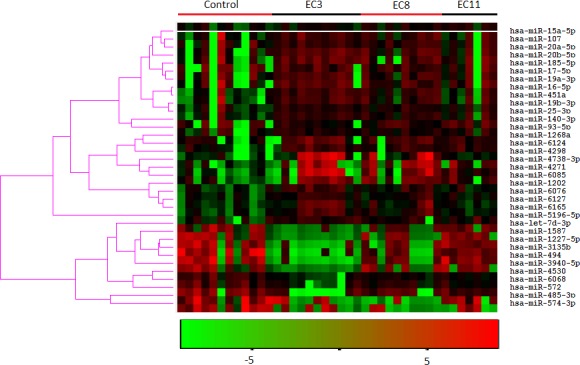
Figure 1. Heatmap of the hierarchical clustering of the 35 differently expressed miRNAs in smokers and non-smokers.

EC3, EC8, and EC11 represent smokers smoked the cigarette which containing 3, 8, and 11 mg tar, respectively. The hierarchical clustering was performed using the software Cluster 3.0 with default parameters (similarity metric: correlation (uncentered); clustering method: Average linkage).
