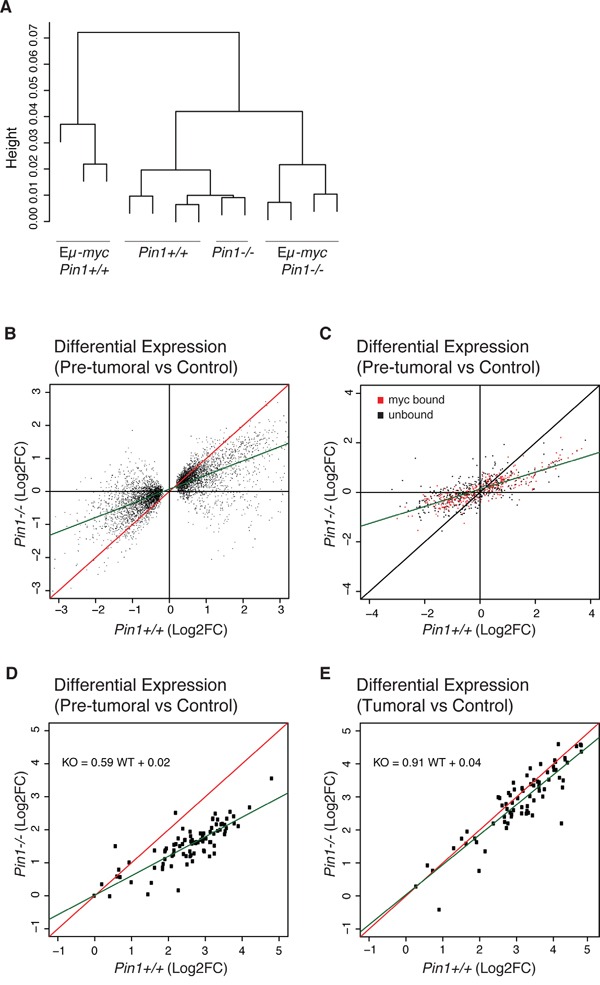
Figure 4. Gene-expression profiling in Eμ-myc Pin1−/− B cells.

Total RNA from control and pre-tumoral Eμ-myc B cells of the indicated Pin1 genotypes was profiled by RNA-seq. A. Unsupervised hierarchical clustering of the sequenced samples. B. Fold-change values (log2FC) for differentially expressed genes (DEGs) in the Pin1−/− relative to the Pin1+/+ background. The DEGs shown here were first defined based on their deregulation in Eμ-myc B relative to control B cells in the Pin1+/+ background (see Methods). C. 754 genes covering the whole expression range and regulatory patterns in Eμ-myc B cells [40] were analyzed by NanoString and reported as in B. The data are based on the average of 3 biological replicates for each genotype. 361 genes previously classified as Myc-bound in pre-tumoral B cells [40] are represented in red, and 393 unbound genes in black. D., E. NanoString analysis of 80 genes that are amongst the most strongly induced in pre-tumoral B cells and are all bound by Myc in their promoter regions [40]: D. and E. show the fold-changes in pre-tumoral B cells and lymphomas, respectively, both relative to control B cells. The green lines in B., C., D. represent the linear regression of the data.
