
Figure 1. MiR-448 is increased in GC and associated with poor prognosis.
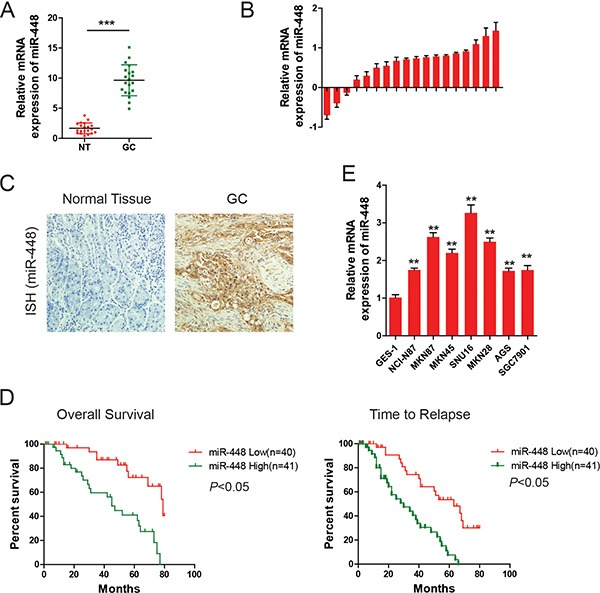
(A) Scatter dot plots show relative mRNA levels of miR-448 in GC and adjacent non-tumor (NT) samples using data from The Cancer Genome Atlas. (B) Forest plots show miR-448 expression in GC tumor and adjacent non-tumor tissues. (C) Representative images of miR-448 expression by ISH. (D) Kaplan-Meier curves of overall survival (OS) and time to relapse (TTR) for GC patients with high/low miR-448 expression. (E) Relative expression of miR-448 in GC cell lines.