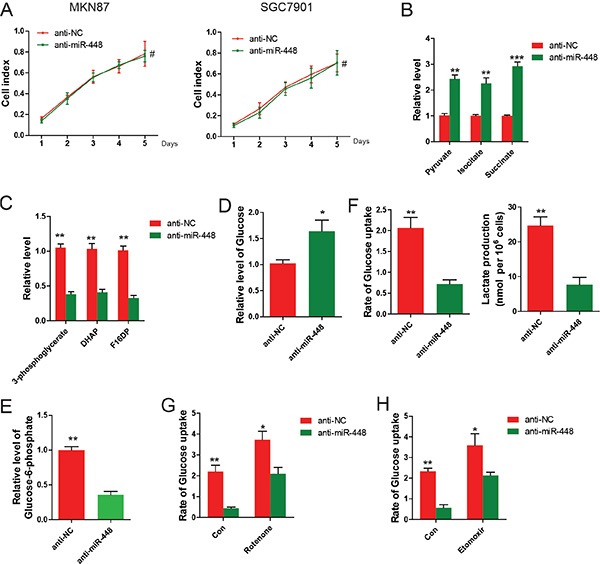
Figure 3. miR-448 knockdown decreases glycolytic and increases mitochondrial oxidative metabolism.

(A) Growth curves of anti-NC and anti-miR-448 GC cells cultured in medium containing galactose. (B) Measurement of TCA cycle intermediates and glycolytic intermediates (C) in anti-NC and anti-miR-448 GC cells. Measurement of glucose (D) and glucose-1-phosphate (E) in anti-NC and anti-miR-448 GC cells. (F) Measurement of glucose uptake and lactate production in anti-NC and anti-miR-448 GC cells. (G) Measurement of glucose uptake in anti-NC and anti-miR-448 GC cells treated with or without 100 nM rotenone for 24 hr before measuring glucose uptake. (H) Measurement of Glucose uptake in anti-NC and anti-miR-448 GC cells treated with or without 50 μg/ml etomoxir for 24 hr before measuring glucose uptake.
