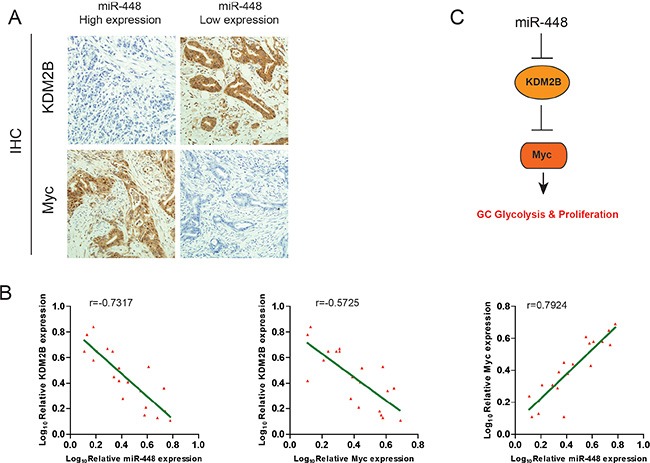
Figure 6. Clinical relevance of miR-448, KDM2B and Myc Expression in patients with GC.

(A) Representative images of IHC staining for KDM2B and Myc in low and high miR-448 expression GC cases. Bars: 50 μm. (B) Correlation between miR-448 expression and KDM2B and Myc expression in the clinical samples. (C) Schematic diagram of the regulatory pathway from miR-448 to glycolysis.
