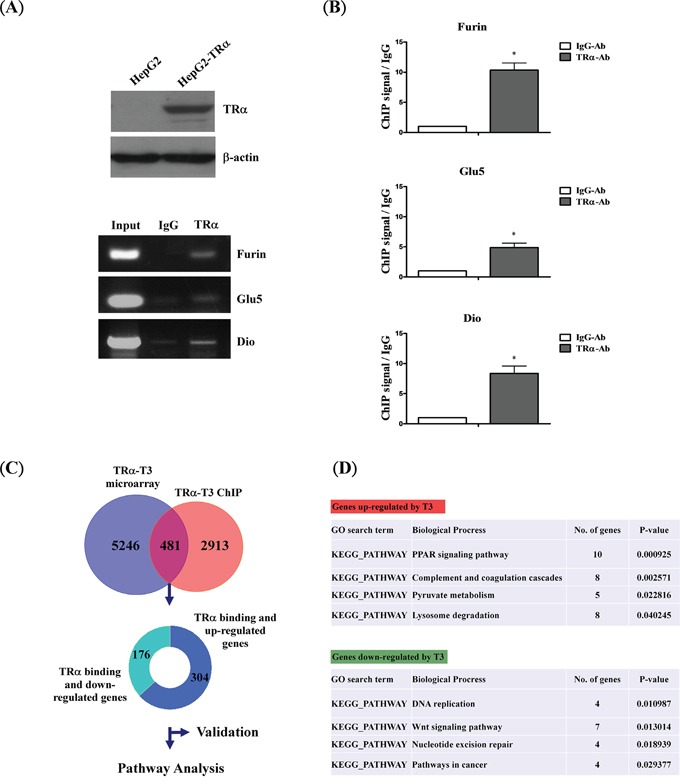
Figure 1. Schematic diagram of ChIP-on-chip analysis.

A. Western blot analysis of TR expression in extracts of TRα1-overexpressing cell lines. The positions of 47 kDa TRα1 are indicated. ChIP assay demonstrating that TRα1 is recruited to the TRE regions of positive control genes (FURIN, GLU5 and DIO) using RT-PCR and B. q-RT-PCR, respectively. C. Overlapping genes between ChIP-on-chip and oligonucleotide microarray in T3-treated conditions. D. Functional pathways of genes directly regulated by T3/TR. Differences were analyzed using one-way ANOVA, *P < 0.05.
