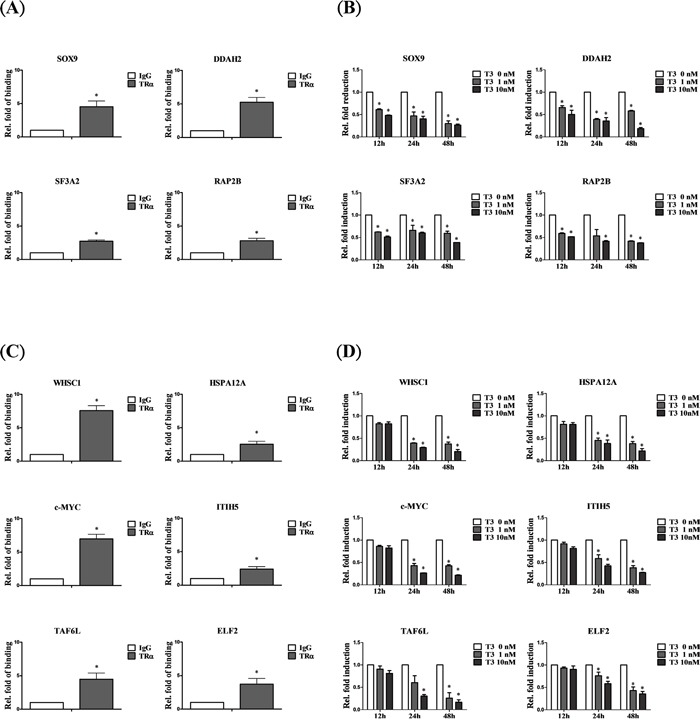
Figure 3. Genes negatively regulated by T3/TR.

A. Relative binding fold, B. q-RT-PCR assessment of expression levels of T3/TR- downregulated genes with rapid responses (12-48 h) in the absence or presence of 1 or 10 nM T3 in HepG2-TRα1cells C, D. T3/TR-downregulated genes with delayed responses. Differences were analyzed using one-way ANOVA, *P < 0.05.
