
Figure 1. Early colonization profile of Symbioflor-2 in a murine CT26 tumor model.
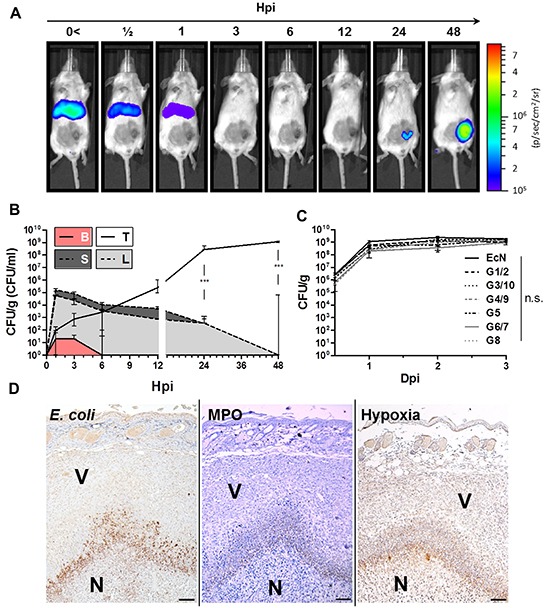
5×10⁵ CT26 tumor cells were inoculated s.c. into wild-type mice. After 10 days, the mice were infected with 5×10⁶ probiotic E. coli. A. Distribution kinetic of strain G1/2 in a murine host upon systemic inoculation. G1/2 contains the plasmid pHL304 encoding the luxCDABE operon, and was detected using an in vivo imaging system (IVIS). B. Colonization profile displaying CFU counts in blood (B), liver (L), spleen (S), and CT26 tumor (T) upon systemic inoculation of G1/2 pHL304. C. Comparison of CT26 tumor colonization between individual Symbioflor-2 strains and EcN on selected time points. D. IHC staining of consecutive CT26 tumor cross sections 48 hpi with pooled Symbioflor-2 strains reveals a pattern of colocalization between E. coli, hypoxic regions and neutrophil accumulation. Specific antibodies were used to detect E. coli. Neutrophilic granulocytes were identified via myeloperoxidase (MPO) staining and regions of hypoxia were stained for presence of pimonidazole metabolites. V and N denote viable and necrotic tumor tissue, respectively. Dpi/ hpi denote days/ hours post infection. Representative IVIS and IHC images are displayed. Scale bar corresponds to 100 μm. N=3-5. Median ± range.