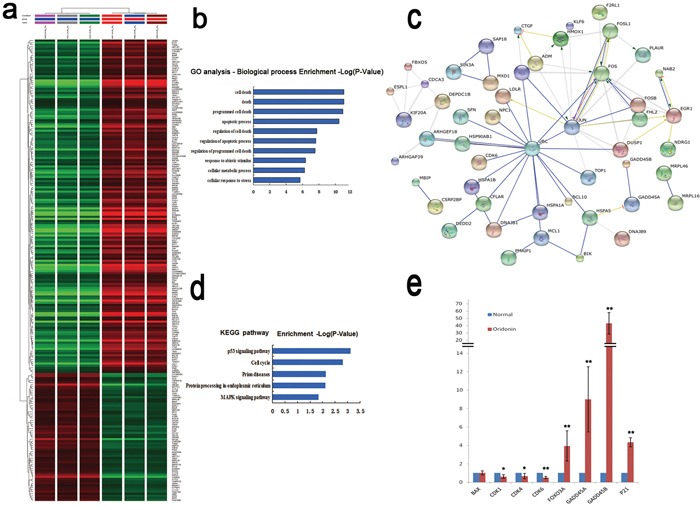
Figure 3. Effects of oridonin on the gene expression profiles in AGS cells assessed by microarray.

a. Clustering analysis of the DEGs upon oridonin treatment using Gene Spring software. Gene expression profiles of AGS cells with or without oridonin treatment were assayed by microarray. b. GO analysis of DEGs for biological processes. c. Interactions among the DEGs revealed by KEGG pathway analysis. d. DEGs enriched in KEGG pathways. e. The relative mRNA expression levels of some p53 downstream genes in AGS cells with or without oridonin treatment revealed by microarray. Bars represent means±S.E.M. (n=3). DEGs: Differently expressed genes; GO: Gene Ontology; KEGG: Kyoto encyclopedia of Genes and Genomes.
