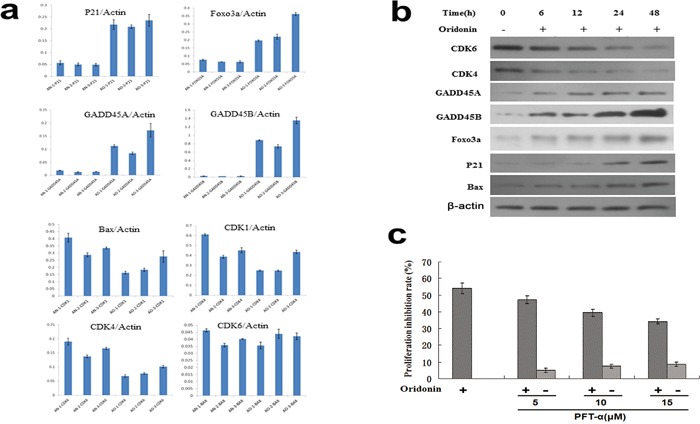
Figure 4. Validation of representative DEGs identified by gene microarray analyses by qPCR and western blot.

a. qPCR assays of the expression levels (normalized to actin) of p21, FOXO3A, GADD45A, GADD45B, Bax CDK1, CDK4 and CDK6. Bars represent means±S.E.M. (n=3). b. Western blot showed that the expression levels of FOXO3A, GADD45A, GADD45B, p21 and Bax increased whereas those of CDK1, CDK4 and CDK6 decreased upon oridonin treatments for 48 hours in AGS cells. c. p53 inhibitor PFT-α partially conteracts the anti-proliferative effect of oridonin on AGS cells in a concentration-dependent manner. Bars represent means±S.E.M. (n=4). *:P<0.05; **P<0.01; DEGs: differently expressed genes; qPCR: quantitative polymerase chain reaction.
