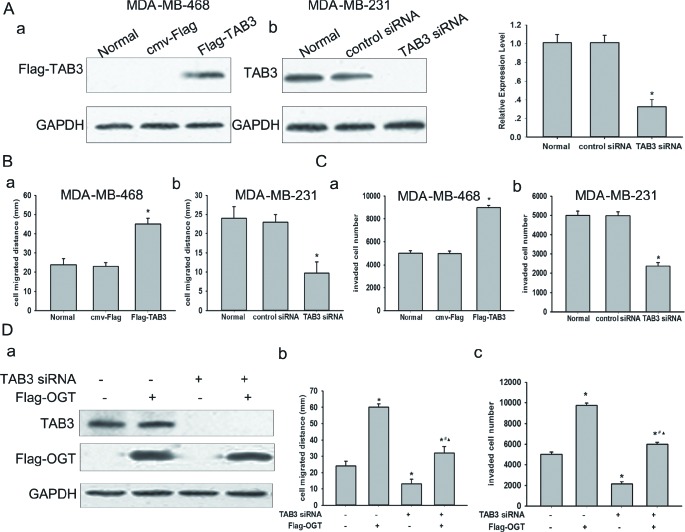
Figure 1. TAB3 involved in OGT promoted TNBC cells migration and invasion.
(A) Protein expression of TAB3 analyzed by Western Blot. MDA-MB-468 cells were transfected with the cmv-Flag and Flag-TAB3 expression vector as indicated (a). MDA-MB-231 cells were transfected with the control siRNA and TAB3 siRNA vector as indicated (b). The data were means ± SEM. *P < 0.05, compared with the untransfected normal group. (B) Equal numbers of indicated stably transfected MDA-MB-468 cells (a) and MDA-MB-231 cells (b) seeded into six-well tissue culture plates. Wound healing assay was performed and analyzed as described under Methods. The data were means ± SEM. *P < 0.05, statistically significant compared with the normal. (C) 106 stably transfected MDA-MB-468 cells (a) and MDA-MB-231 cells (b) cultured in matrigel chambers. Transwell assay was performed and analyzed as described under Methods. The data were means ± SEM. *P < 0.05, compared with the normal group. (D) MDA-MB-231 cells were transfected with Flag-OGT and/or TAB3 siRNA vector. After 48 h, protein expressions of TAB3 and Flag-OGT were analyzed by western blot (a). Cell migration (b) and invasion (c) were assessed as described. The data were means ± SEM. *P < 0.05, statistically significant compared with the untransfected control group; #P < 0.05, statistically significant compared with OGT over-expression group; ▲P < 0.05, statistically significant compared with the TAB3 siRNA transfected group.

