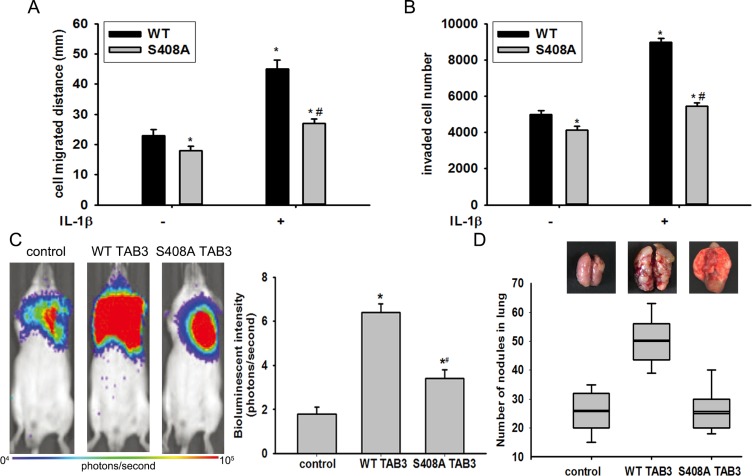
Figure 5. TAB3 O-GlcNAcylation promoted TNBC cell migration and invasion in vitro and in vivo.
(A) Equal numbers of WT and S408A TAB3 stably transfected MDA-MB-231 cells seeded into six-well culture plates in the presence or absence of IL-1β. Wound healing assay was performed and analyzed. The data were means ± SEM. *P < 0.05, statistically significant compared with the IL-1β untreated WT TAB3 transfected group; #P < 0.05, statistically significant compared with IL-1β treated WT TAB3 transfected group. (B) 106 stably transfected and MDA-MB-231 cells cultured in matrigel chambers with or without IL-1β. Transwell assay was performed and analyzed. The data were means ± SEM. *P < 0.05, statistically significant compared with the IL-1β untreated WT TAB3 transfected group; #P < 0.05, statistically significant compared with IL-1β treated WT TAB3 transfected group. (C) WT and S408A TAB3 stably transfected MDA-MB-231 cells were injected into the mammary fat pads of nude mice. The bioluminescent change emitted from the whole bodies of the mice (9 mice per group) after repeated intraperitoneal injections of CDDP. The data were means ± SEM. *P < 0.05, statistically significant compared with the untransfected group. (D) Representative pictures of murine whole lung The number of visible surface metastatic lesions in mice (9 mice per group) was significantly increased in the WT TAB3 group compared to that in S408A TAB3 group.

