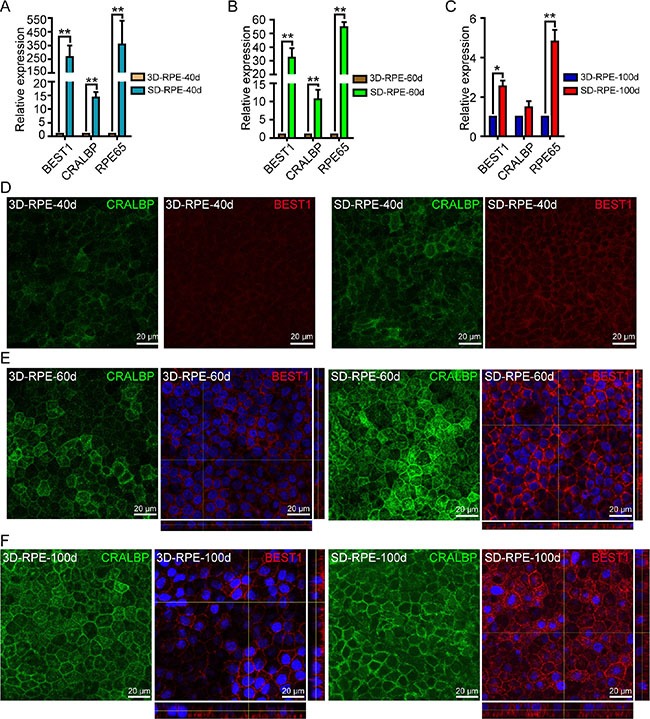
Figure 4. The differentiation of 3D-RPE cells.

(A–C) RT-qPCR analysis of expression of CRALBP, BEST1 and RPE65 in 3D-RPE cells versus time-matched SD-RPE cells at day 40, day 60 and day 100 after differentiation respectively (bars: mean + s.d.; n = 3). All samples were normalized to glyceraldehyde 3-phosphate dehydrogenase (GAPDH). Single asterisk (*) indicated p value < 0.05 and double asterisk (**) indicated p value < 0.01. (D–F) Immunostaining of CRALBP and BEST1 of 3D-RPE and SD-RPE cells at day 40, day 60 and day 100 after differentiation respectively. Z-stack fluorescent images with cross-section side views were displayed to show BEST1 location.
