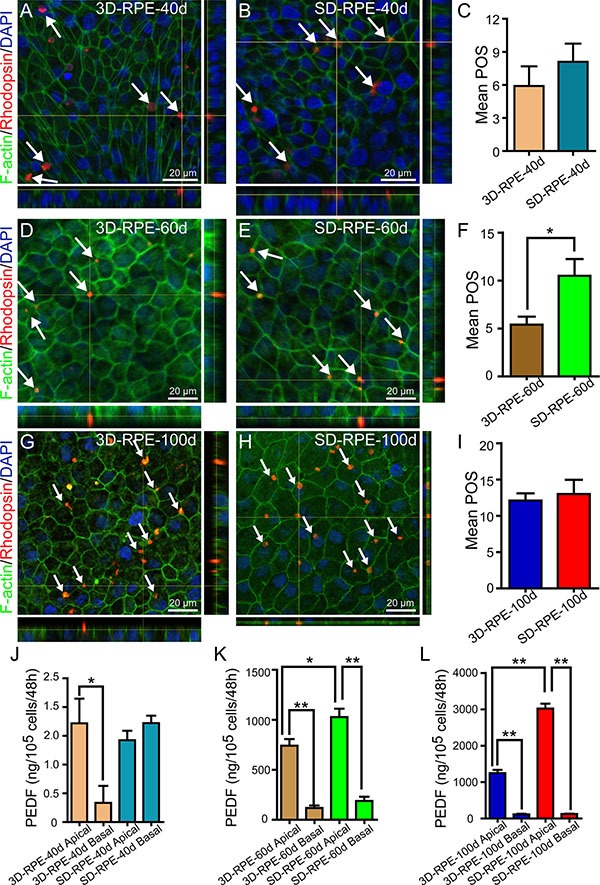
Figure 5. The functions of POS phagocytosis and PEDF secretion in 3D-RPE cells.

(A–B, D–E, G–H) Z-stack fluorescent images with cross-section side views showed the location of internalized POS in 3D-RPE and SD-RPE cells at day 40, day 60 and day 100. POS was immunostained by Rhodopsin (red). F-actin was stained using phalloidin (green) to show the cell morphology. Nuclei were stained with DAPI (blue). Arrows indicated internalized POS. (C, F, I) The number of internalized POS by 3D-RPE and SD-RPE cells at day 40, day 60 and day 100 per field view (135 μm × 180 μm; bars: mean + s.d.; n = 3). Single asterisk (*) indicated p value < 0.05. (J–K, L) ELISA analysis of PEDF secretion by 3D-RPE and SD-RPE cells at day 40, 60 and 100 (bars: mean + s.d.; n = 3). Single asterisk (*) indicated p value < 0.05. Double asterisk (**) indicated p value < 0.01.
