
Figure 2. Joint prognostic values of leukocyte mtDNA content and TNM stage in HCC patients.
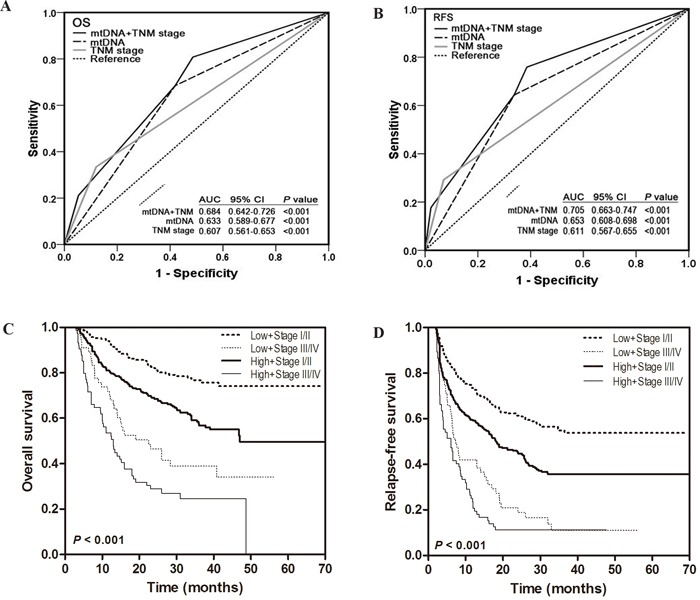
A-B. ROC curve analysis was used to compare the sensitivity and specificity for prediction of OS and RFS by the combined mtDNA content and TNM stage model, mtDNA content alone model and TNM stage alone model. C-D. Kaplan-Meier curves of OS and RFS in subgroups stratified by mtDNA content and TNM stage. Hazards ratios and 95% CIs were calculated by multivariate Cox proportional hazards regression model, adjusted for age, sex, HBsAg, differentiation, TNM stage, serum AFP and mtDNA content as covariates.