
Figure 3. Immunophenotypes of PBMCs and plasma concentration of cytokines in HCC patients with different leukocyte mtDNA content.
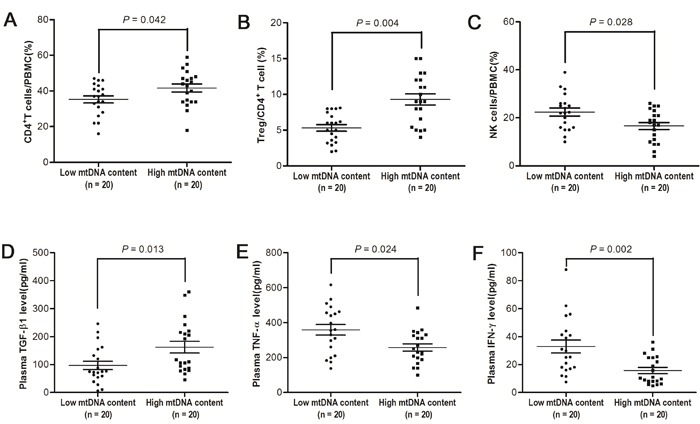
A-C. Flow cytometry analyses for percentage of CD4+ in PBMCs, Treg cells in CD4+ T cells and NK-cells in PBMCs from HCC patients with high and low mtDNA content (both n = 20). D-F. ELISA analyses for the plasma concentrations of TGF-β1, TNF-α and IFN-γ from HCC patients with high and low mtDNA content (both n = 20).