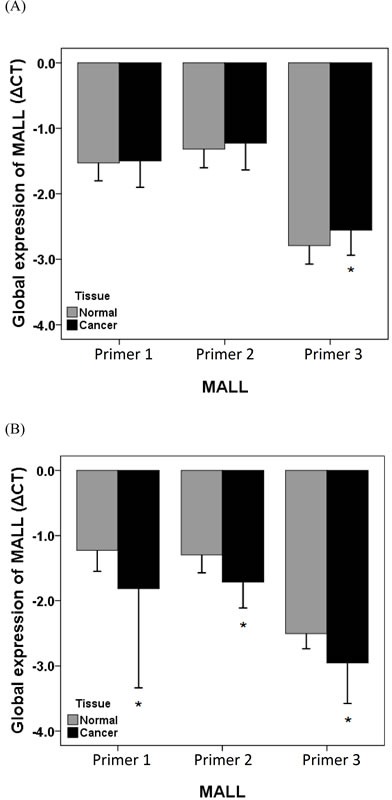
Figure 4. MALL LOH in normal and cancer tissues.

MALL LOH in A. colon and B. rectal cancer tissues was determined by real-time PCR using three separate primer sets with PMP as the internal reference. Data are presented as mean ± standard deviation of three independent experiments. *P < 0.05 indicates a significant difference between the normal and cancer tissues.
