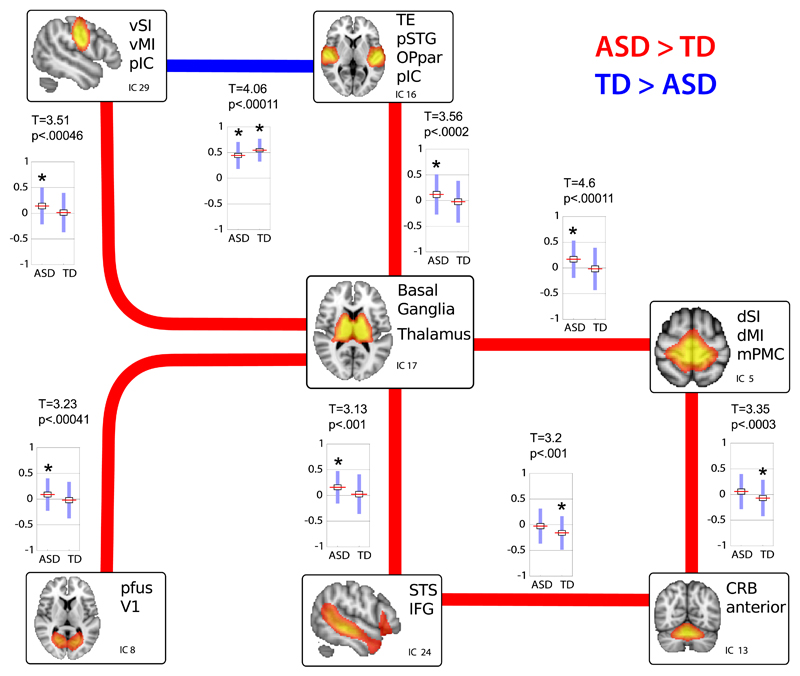
Figure 2. Group differences in between-network connectivity.
Group differences in FNC strength are shown as lines (red indicates increased FNC in ASD with respect to TD participants, blue the reverse situation) together with boxplots of the Pearson correlation values per each group. Boxplots report the mean (red line), standard deviation (blue bars) and standard error of the mean (black rectangle around the mean) of group-level FNC values. Stars above the boxplots indicate those cases in which the mean FNC was found significantly different from zero (at q(FDR)=.05 - see also eTable 5). Results were obtained by comparing the between-network functional connectivity of 166 ASD and 193 TD participants, using nonparametric permutation testing (20,000 permutations) and correcting the final results with q(FDR)=.05, leading to a final threshold of p<0.001. Converting the correlation scores to Z values using Fisher r to Z transformation yielded almost identical results (see eFigure 5).

