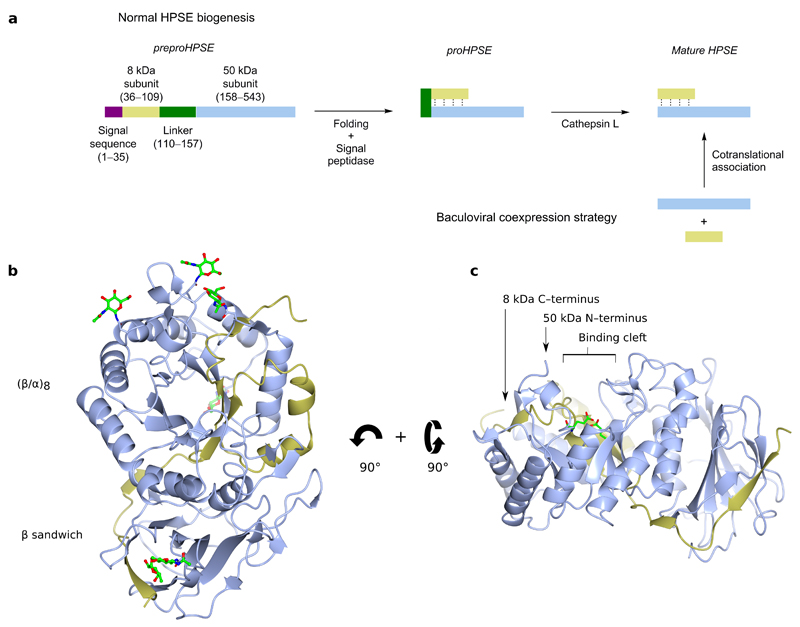
Figure 1.
3D structure of apo HPSE. (a) Schematic representation of HPSE biogenesis, and the coexpression strategy utilized in this study. (b) ‘Front’ view of apo-HPSE in ribbon representation; subunits are colored yellow (8 kDa), and blue (50 kDa). 5 sites of N-glycosylation are shown in green. (c) ‘Side’ view of HPSE showing a binding cleft in the (β/α)8 domain in which the catalytic residues (green) reside.

