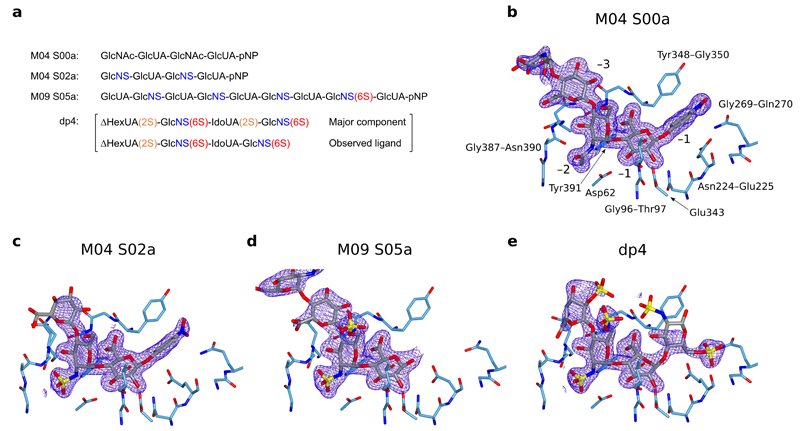
Figure 2.
Active site structures of HPSE in complex with substrate analogues. Densities shown are REFMAC maximum-likelihood/σA weighted 2Fo−Fc syntheses contoured between 0.25 and 0.32 electrons/Å3. (a) Schematic of substrate analogues used in this study, with N-sulfation (blue), 6O-sulfation (red) and 2O-sulfation (orange) highlighted. Structures for sugar monomers are shown in Supplementary Figure 1. pNP refers to paranitrophenol. (b) HPSE active site in complex with M04 S00a, with binding subsites and neighboring amino acids annotated. (c) HPSE in complex with M04 S02a. −3 GlcNS was disordered and has not been modeled. (d) HPSE in complex with M09 S05a. No +1 substituent could be modeled due to poor density, suggesting pNP no longer occupied this subsite. Sugars beyond −4 were disordered and have not been modeled. (e) HPSE in complex with dp4, illustrating interactions made by HPSE to 6O-sulfate at the +1 subsite.

