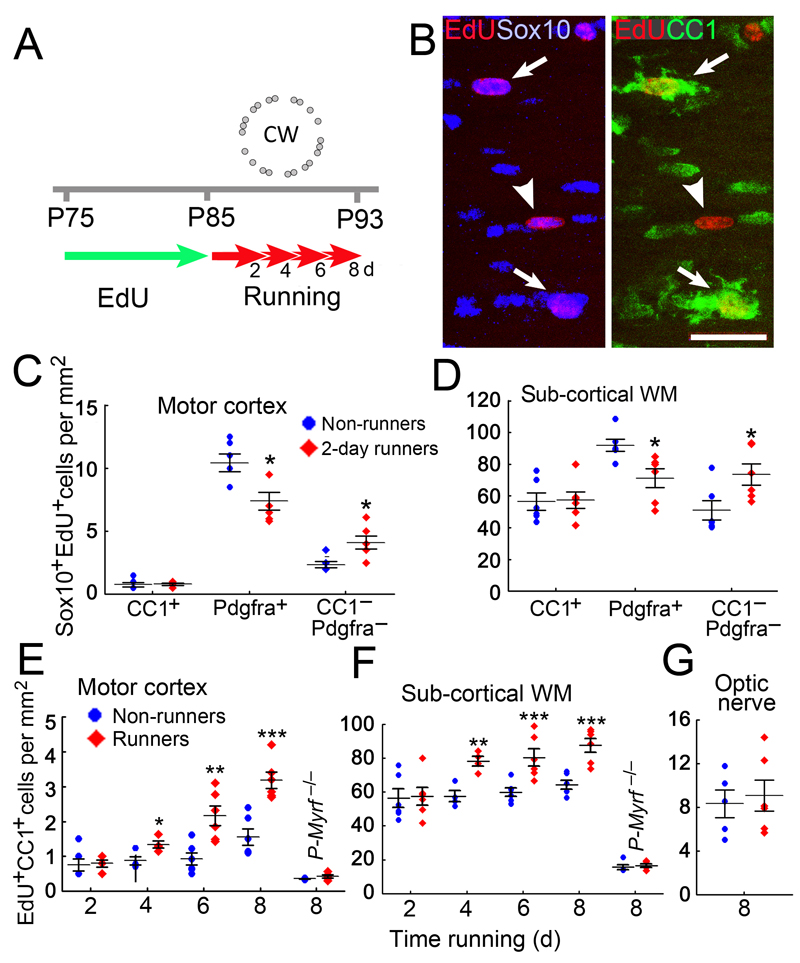
Fig. 2.
Oligodendrocyte dynamics during motor skill learning. (a) Experimental design: all mice (approximately equal numbers of male and female) were given tamoxifen by gavage on 4 successive days (P60 to P63 inclusive), then EdU was administered in the drinking water for 10 days (P75 to P84) before transferring the mice to cages equipped with a complex wheel for up to 8 days. (b) Subcortical white matter of wild type mice housed with a wheel for 8 days (“8-day runners”). The great majority (~97%) of EdU+ cells were also Sox10+ oligodendrocyte lineage cells. At this time point there is a mixture of CC1-negative presumptive OPs (arrowhead) and CC1+ newly-formed oligodendrocytes (arrows). Images are representative of >3 similar experiments. (c,d) Numbers of newly-generated (EdU+) oligodendrocyte lineage cells at different developmental stages in 2-day runners versus control littermates, housed without a wheel (“non-runners”). The number of EdU+ CC1+ newly-formed oligodendrocytes is the same in 2-day runners and non-runners, both in motor cortex (c) and underlying white matter (WM) (d). The number of recently generated OPs (EdU+ Pdgfra+) is decreased in 2-day runners compared to non-runners, with a reciprocal increase in the number of newly-differentiating oligodendrocytes (EdU+ Pdgfra– CC1–). (e,f) Production of (EdU+ CC1+) new myelinating oligodendrocytes is accelerated in both motor cortex (e) and subcortical white matter (f) of runners versus non-runners. The new oligodendrocytes accumulate between 4 and 8 days running. The number of new oligodendrocytes is strongly reduced in P-Myrf –/– mice, both runners and non-runners, compared to wild type mice (non-runner 8 days, Motor cortex: p=0.00091, t= –4.71, df=9; Sub-cortical white matter: p<10–5, t= –15.43, df=9; n=6 for wild type mice, n=5 for Myrf –/– mice). (g) Production of new myelinating oligodendrocytes (EdU+ CC1+) in the optic nerve is not increased by running (p=0.71, t= –0.39, df=9, n=5 runners, n=6 non-runners). All data from runners versus non-runners were compared by two-tailed unpaired t-test. Error bars indicate s.e.m. *p < 0.05, **p < 0.01, ***p < 0.001. Scale bar in B: 40 μm.
[(c) CC1+, p=0.81, t= –0.25; Pdgfra+, p= 0.012, t=3.1; Pdgfra–, CC1–, p=0.012, t= –3.1, df=10, n=6 mice] [(d) CC1+, p= 0.90, t= –0.13; Pdgfra+, p=0.014, t=2.94. df=10. n=6 mice.] [(e) 2 day, p=0.90, t= –0.13, df=10, n=6 mice each group; 4 days, p=0.027, t= –2.90, df=6, n=4 mice each group; 6 days, p=0.0039,t= –3.73, df=10, n=6 mice each group; 8 days (WT), p=0.0006, t= –5.0, df=10, n=6 mice each group; 8 days (Myrf –/–), p=0.18, t= –1.47, df=8, n=6 mice each group.] [(f) 2 days, p=0.61, t= –0.53, df=10; n=6 mice each group; 4 days, p=0.003, t= –4.8, df=6, n=4 mice each group; 6 days, p=0.0027, t= –3.54, df=10, n=6 mice each group; 8 days (WT), p=0.0007, t= –4.82, df=10, n=6 mice each group; 8 days (Myrf –/–), p=0.61, t= –0.53, df=8, n=5 mice each group.]

