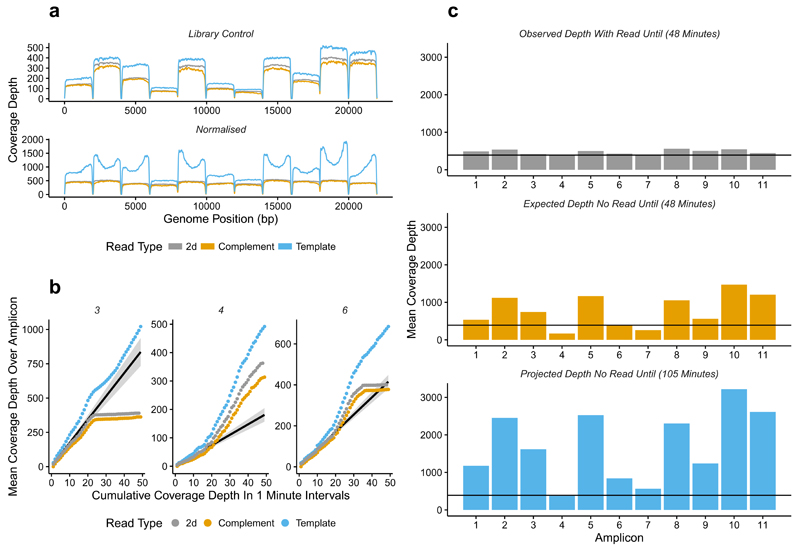
Figure 3.
Normalization of amplicons in a library using “Read Until”. (a) shows coverage over each of the 11 amplicons without “Read Until” (top pane) and with “Read Until” applied (bottom pane) trying to normalize coverage. Gray - 2D reads, Orange - complement, Blue - Template. (b) shows the cumulative coverage for three representative amplicons (3,4,6) in 1 minute intervals. The black line is predicted 2D coverage for each amplicon calculated by fitting to the first 15 minutes of data. (c) shows the observed 2D coverage after 48 minutes (top pane), the total coverage predicted for each amplicon based on the first 15 minutes of sequencing (middle pane) and the projected depth if the reads were allowed to accumulate without “Read Until” until each amplicon exceeded the minimum coverage threshold, which would take approximately 105 minutes (bottom pane).

