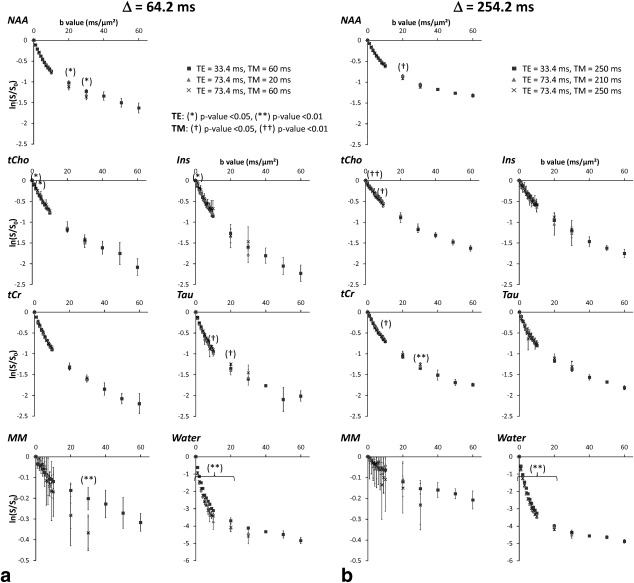
Figure 5.

A,B: Logarithm of signal attenuation for each metabolite and each TE/TM combination at the two different diffusion times, as a function of b. Error bars stand for the standard deviations determined on four mice. Asterisks indicate significant difference for different TE values: *P < 0.05, **P < 0.01. Daggers indicate significant difference for different TM values: †P < 0.05, ††P < 0.01.
