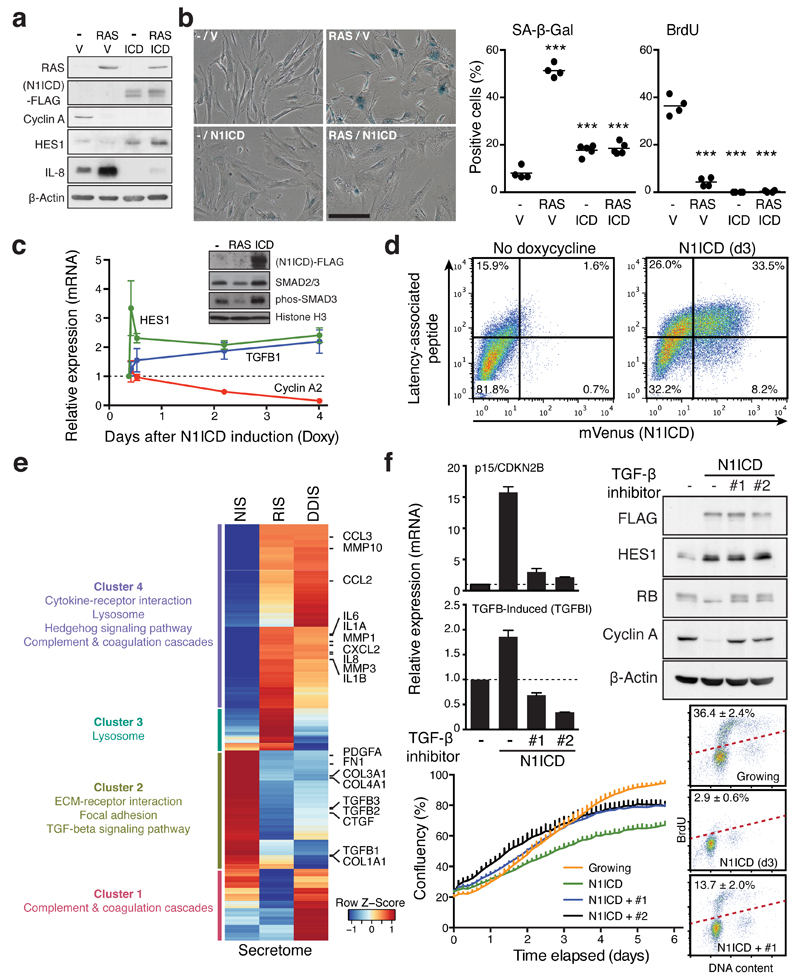
Figure 3. NOTCH1 drives a cell-autonomous senescence with a distinct secretory profile.
(a and b) ER:HRASG12V IMR90 cells, stably expressing N1ICD-FLAG or control vector (V), were incubated with or without 4OHT for 6 days and analysed for expression of indicated proteins by immunoblotting (a), SA-β-gal and BrdU incorporation (b). One way ANOVA with Dunnett's multiple comparison test; bars are means of ≥200 cells, n = 4 biologically independent experiments. ***P ≤ 0.001 versus control cells. Scale bar 100μm. (c) Time series analysis of indicated transcripts after doxycycline (Doxy) induction in TRE-N1ICD-FLAG IMR90 cells by qRT-PCR. Values are mean ± SEM, n = 3 biologically independent experiments. Inset, immunoblotting of fractionated chromatin in IMR90 cells expressing HRASG12V (d6) or TRE-N1ICD-FLAG (d3) for downstream TGF-β phosphorylation-target SMAD3 (phos-SMAD3). (d) TRE-N1ICD-mVenus IMR90 cells with or without 3 days of doxycycline were analysed for cell surface expression of the TGFB1 gene product latency-associated peptide by flow cytometry. (e) Differentially expressed transcripts in N1ICD-, HRASG12V- or Etoposide-induced senescent IMR90 cells (NIS, RIS, or DDIS, respectively), compared to normal control cells. Heat map shows z-score normalised fold changes of 1150 secretome genes differentially expressed in at least in one comparison. Representative KEGG pathways enriched in four clusters (False discovery rate (FDR) < 0.01) are shown. (f) TRE-N1ICD-FLAG IMR90 cells treated with or without doxycycline for 3 days with or without TGF-β receptor antagonists (#1, SB431542; #2, A83-01) were analysed by qRT-PCR and immunoblotting for the indicated mRNA and proteins in addition to proliferation and cell cycle analyses. Values are mean ± SEM, n = 5 biologically independent experiments for CDKN2B; n = 4 biologically independent experiments for TGFBI. Statistics source data for b, c & f are provided in Supplementary Table 2.

