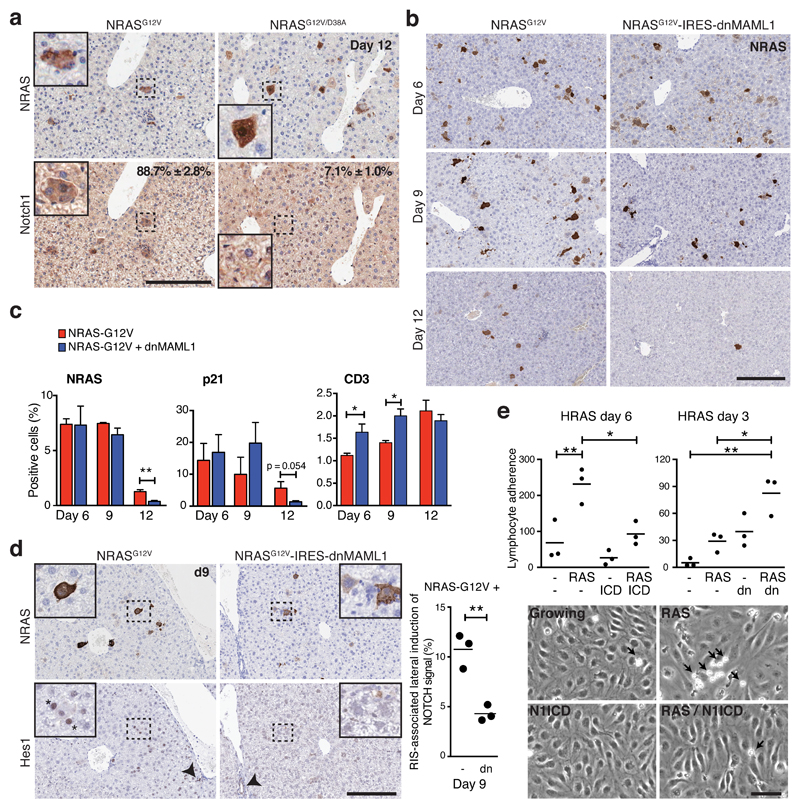
Figure 6. NOTCH1 is dynamically upregulated within NRAS-senescent hepatocytes and inhibits senescence surveillance.
(a) Livers were harvested from mice 12 days after hydrodynamic tail vein injection of NRASG12V or inactive NRASG12V/D38A-bearing transposons and analysed by immunohistochemistry for NRAS and Notch1 expression in serial sections; Quantification of NRAS+ hepatocytes expressing NOTCH1; values are mean ± SEM from manual counting of ≥200 cells; n = 3 mice per condition. Insets, magnified pictures of dotted rectangular areas. Scale bar 200 μm. (b) Time series analysis of hepatic NRAS-expression by immunohistochemistry after injection of NRASG12V(-IRES-mVenus) or NRASG12V-IRES-dnMAML1(-mVenus). Scale bar 200 μm. (c) Quantification of NRAS, p21, or CD3 (T-lymphocyte marker) positive cells within livers of mice treated as in (b); unpaired T-test; values are mean ± SEM from manual counting (NRAS) or automated image analysis of ≥105 cells (p21 / CD3) from liver sections (see METHODS); for NRASG12V injected animals at D6, 9 & 12, n = 3, 3 & 4 mice respectively; for NRASG12V-IRES-dnMAML1 injected animals at D6, 9 & 12, n = 4, 3 & 5 mice respectively; *P ≤ 0.05, **P ≤ 0.01. (d) Lateral induction of Notch signalling in mouse livers treated as in (b). Representative immunohistochemistry of NRAS and Hes1 at d9 in serial sections. Insets, magnified pictures of dotted rectangle areas. Asterisk demonstrates Hes1-expressing, NRAS-negative cells adjacent to NRAS-expressing hepatocytes. Arrowheads demonstrate positive internal control staining of Hes1 within cholangiocytes. The percentage of NRAS-positive cells with adjacent Hes1-positive (but not NRAS) were manually counted; n = 3 mice per condition; bars are means; unpaired T-test. Similar results were also obtained using dual staining in the same section (Supplemental Fig. 6C). Scale bar 200 μm. (e) Flow-based assay of peripheral blood lymphocyte (PBL) adherence (cells/mm2/106) to human liver sinusoidal endothelial cells (HSEC) from 3 separate individuals pre-incubated with conditioned media (CM) from IMR90 cells expressing ER:HRASG12V and TRE-N1ICD with or without 4OHT (d6) and/or doxycycline (d3) (left; n = 3 biologically independent replicates or CM from ER:HRASG12V IMR90 cells, expressing dnMAML1-mVenus or matched control and incubated with or without 4OHT for 3 days (right; n = 3 biologically independent replicates) (see Supplementary Fig. 7A, B). Representative images (bottom) demonstrating adherent PBLs (arrows) to HSEC after pre-incubation with indicated CM. One way ANOVA with Dunnett's multiple comparison test; bars are mean; *P ≤ 0.05, **P ≤ 0.01. Scale bar 50μm. Statistics source data for a, c, d & e are provided in Supplementary Table 2.

