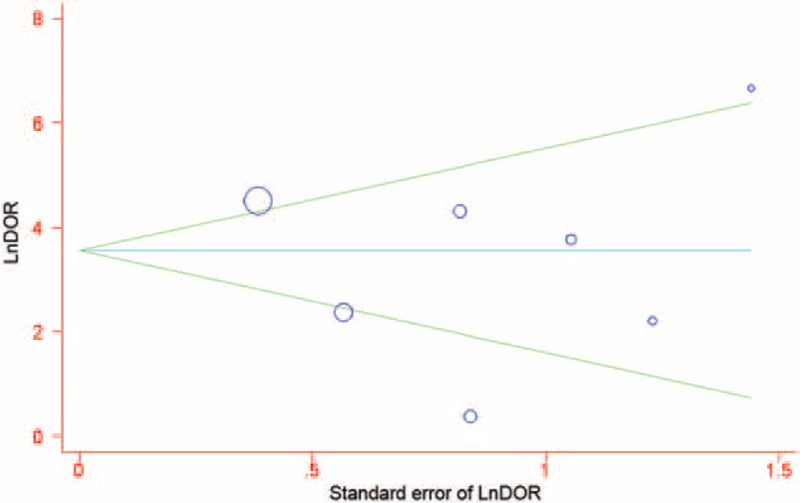
FIGURE 7.

Funnel graph for the evaluation of potential publication bias in procalcitonin assays. Symbol size for each study is proportional to the study size. The line in the center indicates the summary DOR. The Egger test for publication bias was not significant. DOR = diagnostic odds ratio.
