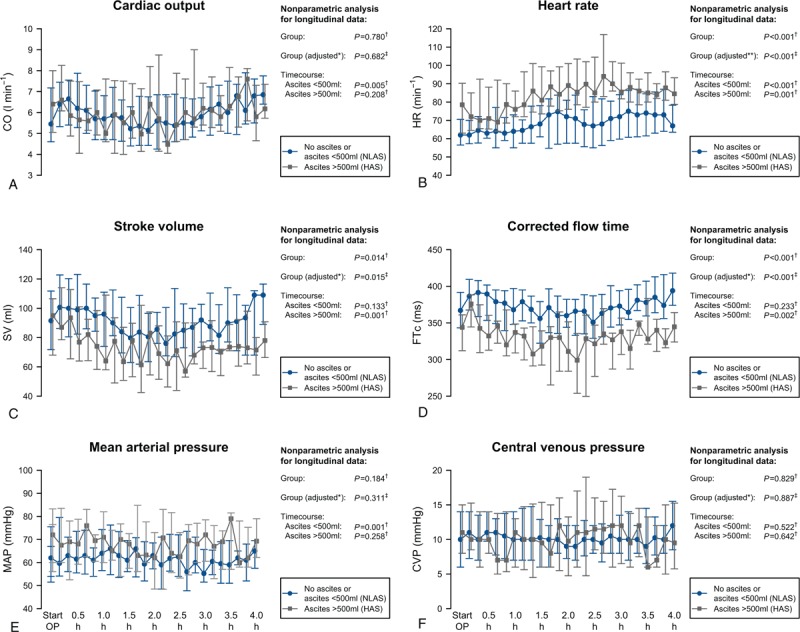
FIGURE 3.

Intraoperative course of cardiac output (A), heart rate (B), stroke volume (C), corrected flow time (D), mean arterial pressure (E), and central venous pressure (F). Data are shown as median and (25%; 75%) quartiles. Results of the nonparametric analysis with respect to time courses are indicated. P Values calculated using NparLD† or GEE‡. ∗Adjusted for randomized study groups of the main study. ∗∗Adjusted for randomized study groups of the main study and beta blocker therapy. GEE = general estimating equation, NparLD = nonparametric analysis for longitudinal data.
