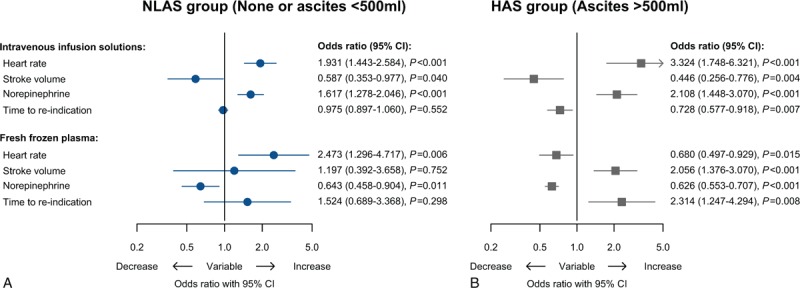
FIGURE 5.

Forest plot visualizing the association of administered infusion solutions and fresh frozen plasma with heart rate and stroke volume, norepinephrine dose, and time to reindication by presenting adjusted odds ratios (OR) obtained from GEE regression analysis for longitudinal data with adjustment considering multiple measurements per patient. Odds ratios are drawn on a logarithmic scale. Odds ratios of heart rate, stroke volume, norepinephrine, and time to reindication are scaled for changes of min−1, mL, 0.01 μg kg−1 min−1 and min, respectively. GEE = general estimating equation, OR = odds ratios.
