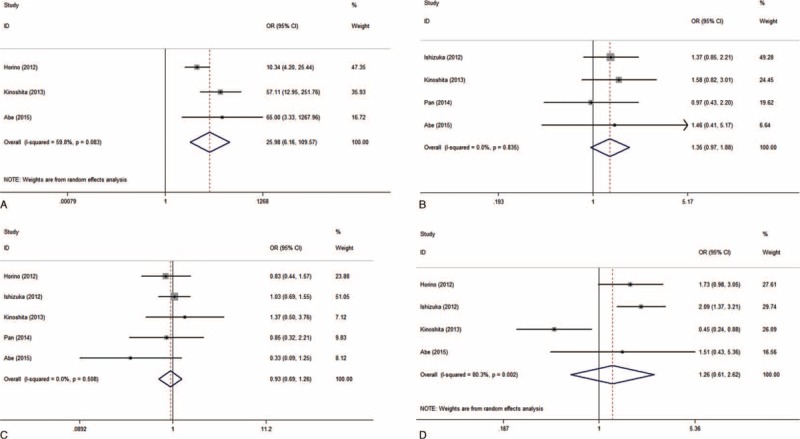
FIGURE 4.

A, Forest plot of odds ratio for the association between elevated Glasgow Prognostic Score and Child–Pugh class (Child–Pugh class B and C versus Child–Pugh class A). B, Tumor number (multiple versus solitary). C, Status of hepatitis B surface antigen (positive versus negative). D, Status of hepatitis C virus antibody (positive versus negative) in patients with hepatocellular carcinoma with random effects model.
