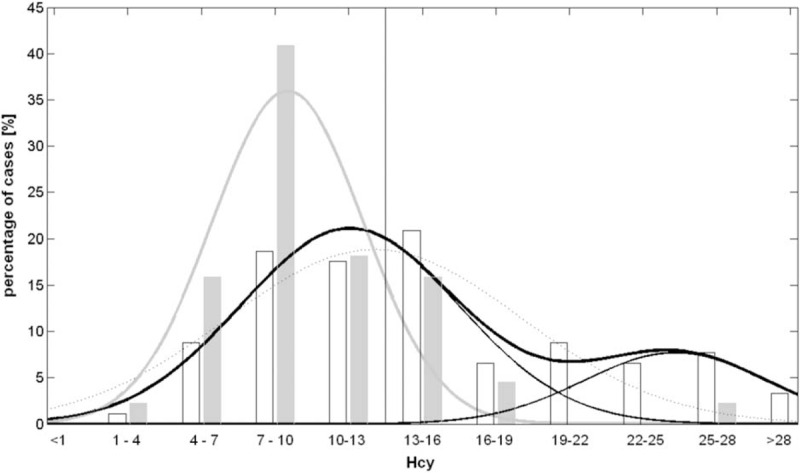
FIGURE 1.

Histogram plot of HCY for PAD-Amp (black empty bars) and NOPAD-Amp (gray empty bars) in 11 ranges (the higher value for each range should be considered appertaining to the successive range). Gaussian fits are also reported: for NOPAD-Amp wide gray line and for PAD-Amp black lines (dot line: simple Gaussian, wide solid line: double Gaussian, thin solid lines: the 2 Gaussian distributions forming the double one).
