Supplemental Digital Content is available in the text
Abstract
A multicenter study conducted in healthy population of 6 cities from the 4 corners and central China for 7 serum-specific proteins to identify the sources of variation and establish the reference intervals on 2 automation platforms.
A total of 3148 subjects aged 19 to 64 years old were enrolled in this study to ensure at least 120 participants in each 10-year age group and each city. The majority of samples were transported to central laboratory and measured on both Beckman AU5800 and Immage 800 analytical systems. Three-level nested ANOVA, multiple regression analysis, and the scatter plot were used to explore the variations from sex, age, region, BMI, cigarette smoking, and so on. The latent abnormal value exclusion (LAVE) method was applied at the time of computing RIs as a method for secondary exclusion.
Regionality was not observed in any of the immunoassay in China. Variations for sex were significant for IgM among the immune analytes. For CRP and hsCRP results with turbidimetry method (Beckman Coulter AU5800) were lower than the nephelometry method (Beckman Immage). The LAVE method did not affect the RIs computed for the majority of analytes except C4, CRP, and hsCRP. In the scatter plot at the age of 45 years old C3, C4, and IgM reached an inflection point, accordingly RIs were separated by the age group.
With the lack of regional differences and the well-standardized status of test results, the RIs of C3, IgG, IgA, IgM derived from this nationwide study can be used for the entire Chinese population. C4, CRP, and hsCRP were affected by different platforms and gender was a significant source of variation for IgM, so they had separated RIs.
INTRODUCTION
Although the Organization for Standardization (ISO) and Clinical and Laboratory Standards Institute (CLSI) has published ISO15189 and CLSI C28-A1 encouraging every lab to establish its own reference intervals, it is unrealistic that hundreds of different level laboratories in China will actually do so. Based on the manufacturers’ package inserts and the National Guide to Clinical Laboratory Procedures (3rd edition),2 most laboratories have only verified the reference intervals of main assays using <120 samples. However, just 120 samples are not representative enough.
Despite the fact that several national studies in China3–5 have focused on reference intervals for chemistry assays, there has been no large-scale study of specific proteins. As the reference material CRM470 has been certified by IFCC (now called ERM-DA470/IFCC),6 most reagents of serum-specific proteins are traceable to CRM470.7 But method discrepancy of specific proteins remains a significant gap between different analytical systems and laboratories implementing multicenter reference interval studies. In our practice, a good correlation of nephelometry method on the Siemens BNII and the Beckman Coulter IMMAGE 800 system with the turbidity method on the Beckman Coulter AU system was only noted in IgG, IgA, and IgM out of all serum proteins (unpublished). Therefore, more data from the 2 methods need to be collected and reference intervals based on big data could be established with strict screening.
The IFCC Committee for Reference Intervals and Decision Limits (C-RIDL) has recently arranged an international multicenter reference interval study, with the utility of a sera panel for the alignment of test results among laboratories. As part of this international study, we organized a nationwide study with the same SOP and 2 different platforms. The aim of our study was to (1) determine the reference interval of serum-specific proteins by strict study design; (2) compare the results from different platforms; and (3) compare the reference intervals after harmonizing the results by the sera panel.
MATERIALS AND METHODS
Study Population and Sample Size
A representative sample of the general Chinese population, aged 19 to 64 years, in 6 cities from the 4 corners and central China was recruited by posters or oral invites to a physical examination center within 1 of the following 5 hospitals: Peking Union Medical College Hospital, the First Affiliated Hospital of Dalian Medical University, the First Affiliated Hospital of Sun Yat-sen University, the Third Affiliated Hospital of Third Military Medical University, the Second Affiliated Hospital of Zhejiang University School of Medicine and Xinjiang Medical University. An even distribution of sex and age was ensured by volunteers who tabulated data. Written informed consent was obtained from each participant before data collection. The protocol based on the IFCC/C-RIDL protocol was approved by the Ethics Committee of Peking Union Medical College Hospital.
Within the 19- to 49-year-old age range, every 10-year span was classified as a group. The oldest group was from 50 to 64 years old. To ensure at least 120 participants were in each age group (half male and half female), each subcenter collected at least 480 samples. Healthy people over 65 years were relatively few in population; therefore 40 volunteers (also half male and half female) were defined as feasible. The total expected sample size was 520 for each subcenter, for a total of 3120 samples.
Inclusion and Exclusion Criteria
Inclusion and exclusion criteria were set according to the IFCC/C-RIDL protocol,8 yet with more specific details.
Inclusion Criteria
Participants >19 years old, of Han nationality, living in their current residence for >1 year.
Exclusion Criteria
Participants with known systemic diseases, including diabetes mellitus, hypertension, cardiovascular disease, renal disease, autoimmune disease, hypersensitivity disease, gastrointestinal disease, pulmonary disease, or cancer, were excluded. Other notable exclusions included having a fever or acute inflammation or taking antibiotics within the last 2 weeks, hospitalization within a month, pregnancy or lactation or childbirth within 1 year, and sample collection after night shift or violent motion. Participants having a BMI≥28 kg/m2 or ≤18.5 kg/m2, smoking ≥20 cigarettes daily, or drinking >75 g of alcohol daily were excluded, too. Well-trained colleagues assisted the participants to complete the questionnaires, which included the inclusion and exclusion criteria.
Blood Collection and Handling
Trained medical personnel collected data on risk factors via questionnaires, anthropometric measurements, and blood samples for biochemical assessments. Preparation for sampling, sampling and sample processing procedures were conducted using the most recently published guidelines in the IFCC/C-RIDL protocol.8 During sampling, 12 mL of blood was collected into gel serum separator tubes (BD or VACUETTE). The time of sampling was 7 am to 10 am. Thirty minutes after sampling, the samples were centrifuged at 1200 g for 10 min at 20 °C.
The serum from the specimens was promptly divided into 5 aliquots of 1.2 mL each, using well-sealed freezing containers, and was immediately stored at −80 °C. Four aliquots, packed in dry ice, were transported to the central laboratory in Beijing within 1 month, except for samples drawn from Chongqing, which were measured on the same equipment in local laboratory.
Measurement
IgG, IgA, IgM, C3, C4, CRP, and hsCRP measurements were performed following the manufacturer’ s package inserts for Beckman Coulter reagents on the IMMAGE 800 analyzer and the AU5800 analyzer (Beckman CoulterInc, Brea, CA) within 3 months. A panel of sera freshly prepared from 80 healthy volunteers was measured in 4 laboratories located in US, Turkey, and Japan. The panel of serum was used as the Standard Reference Materials (SRMs) to ensure traceability of the test results and as the material for comparison of values with other countries. The results are listed in Table 1 of the Supplemental Data. The central laboratory prepared a mini-panel of 5 sera from healthy individuals and measured them individually on each day of measurement to monitor the stability of the assay. The results are listed in Table 2 of the Supplemental Data. Results from the AU analytical system were marked with _AU (eg, IgG_AU, C3_AU, CRP_AU); results from the IMMAGE analytical system were marked with _IMG (eg, IgG_IMG, C3_IMG, CRP_IMG).
Quality Control
Quality control (QC) from the manufacturer (VigilTM Protein control level 1– level 3: 450120, 450125, 450130, VigilTM Serology control level 1–level 3: 450162, 450163, 450164) and the mini-panel of 5 sera were measured every batch. When QC fell in allowable limits, the measurement of sample will continue (see Table 2 in the Supplemental Data). The analytical coefficient of variation (CVa) was computed for each analyte from the results of repeated measurements of the same panel measured in the central laboratory in Beijing. The desirable limits for between- and within-day CVs were set as 1/2 of intra-individual biological CV, as defined by Ricós et al9 and reported in the Westgard website.
Statistical Analysis
The characteristics of the study population were calculated by SPSS 11.0 software. The test results were evaluated by use of the same statistical procedures used in the previous study.8 Statistical analyses and 3N-ANOVA were performed with general purpose statistical software StatFlex for Windows Ver. 6.0 (Artech, Osaka, Japan). Original software, named “Reference Master” and developed by the first author, was used to derive reference intervals based on the LAVE principle and parametric methods.
In brief, sources (factors) of variations were analyzed by 3-level nested ANOVA (3N-ANOVA) and multiple regression analysis (MRA). The relative magnitude of each standard deviation (SD) was expressed as the ratio of SD (SDR) over SDRsex, SDRage, and SDRreg for SD based on sex, age, and region, respectively. Following the IFCC/C-RIDL protocol, an SDR >0.3 was regarded as a guide to consider partitioning reference values by the factor. The method using this cutoff was called the Ichihara method and has been verified with other method.10 MRA considered more factors influencing the test results, including sex, age, BMI, cigarette smoking, daily alcohol consumption, and regular physical exercise, with respective levels. A given explanatory variable was considered to be of practical importance when its standardized partial regression coefficient, which corresponds to the partial correlation coefficient (rp), was >0.20.
Reference intervals derived by the parametric method after normalizing the data by use of the modified Box-Cox power transformation method were compared with those derived by the nonparametric method in both sexes and in each decade of age. The latent abnormal value exclusion (LAVE) method10 was applied at the time of computing the reference intervals as a method for secondary exclusion. The 90% confidence intervals (CI) of the lower and upper limits of the reference intervals (LRLs and URLs) were calculated using the bootstrap method, both for the parametric and nonparametric methods, through random resampling of the same dataset 30 times.
To compare the result of serum pool with assigned value, the least-square regression line was derived using the assigned values (x) and all measured values (y), each specimen in 9 replicates, and the regression line was used for recalibration of the RI.
RESULTS
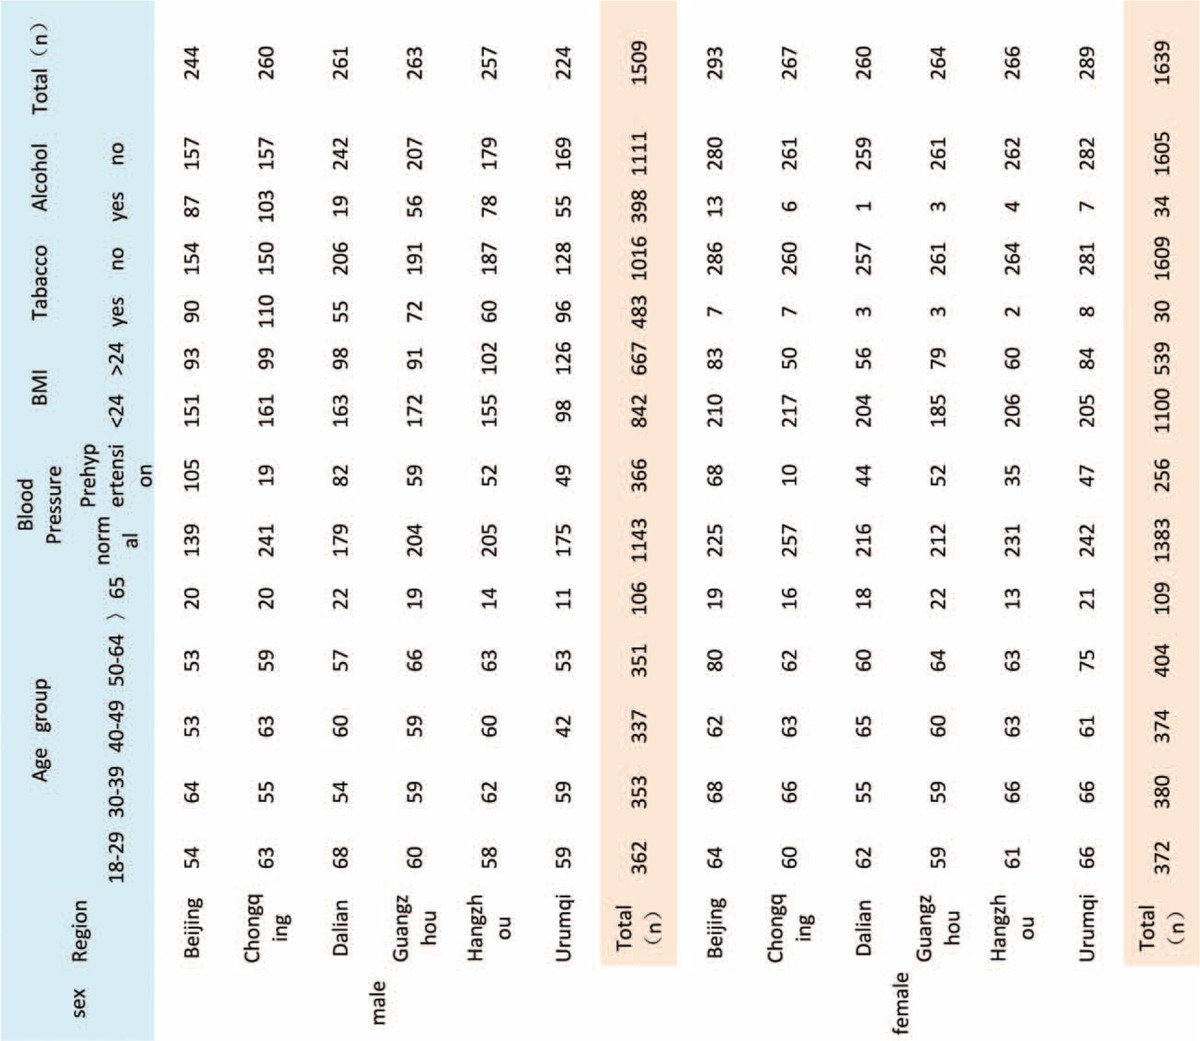
After data collection, a total of 3148 subjects were enrolled in this study. Due to missing values and out-of-range values, the final data represented <3148 participants. The demographic characteristics of the volunteers from the 6 regions of China are shown in Table 1. The number of each age group between 19 and 64 years old was nearly the same. The male-to-female ratio was close to 1 (Table 1). Prehypertension was defined as SBP <130 mm Hg. The ratio of people with prehypertension was significantly different, with Beijing having the highest ratio and Chongqing having the lowest ratio. BMI >24 was classified as overweight. Urumqi showed a higher ratio of overweight male participants. The proportion of smoking and alcohol consumption in Chongqing was highest, whereas Dalian was the lowest. There was an excellent agreement of test values within the assigned values (see Table 1 of the Supplemental Data). The within- and between-day CVs for all analytes, listed in Table 2 of the Supplemental Data, did not exceed the desirable limits reported in the Westgard website.
TABLE 1.
Characteristics of the Study Population From the 6 Regions of China
By use of 3-level nested ANOVA, a primary analysis of sources of variants was implemented, including possible variants from sex, region, and age. Sex-related differences (SDR > 0.3) were observed for 3 analytes (IgG_AU, IgM_IMG, IgM_AU), and age-related differences for 2 analytes (C3_AU, C4_AU, C4_IMG), as shown in Table 2). No significant regional difference was observed in any of the analytes in both males and females (Table 2). The SDs of CRP_AU, CRP_IMG, hsCRP_AU, and hsCRP_IMG were wider than mean of the value, which imply the large degree of dispersion and transformation needed. The SDs of IgG_ IMG and IgG_AU were obviously bigger than IgA and IgM which was shown in the scatter plots from the wide data distributions (Fig. 2).
TABLE 2.
Nested ANOVA for Comparison of the Results Partitioned by Sex, Age, and Region (The Color Backgrounds Indicate SDR>0.3)
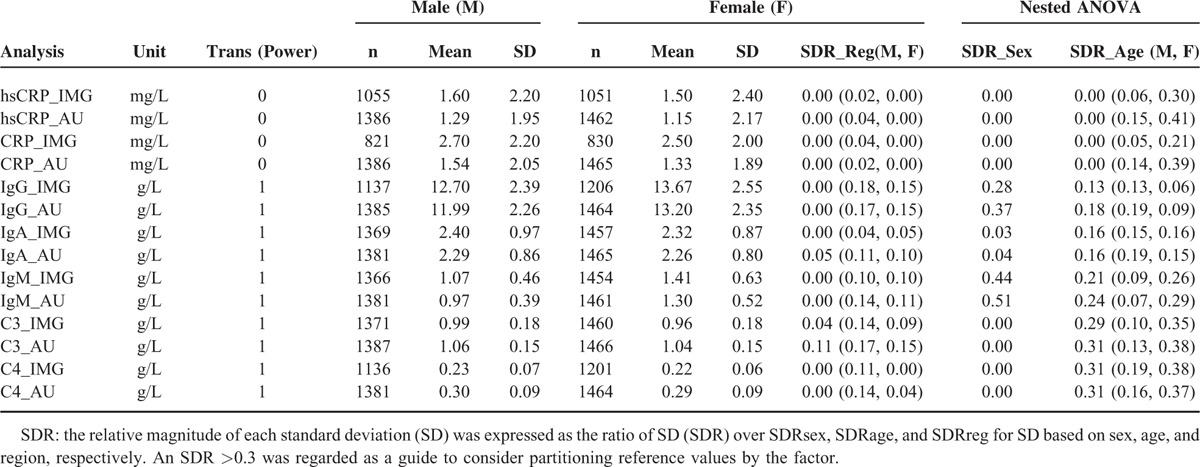
FIGURE 2.
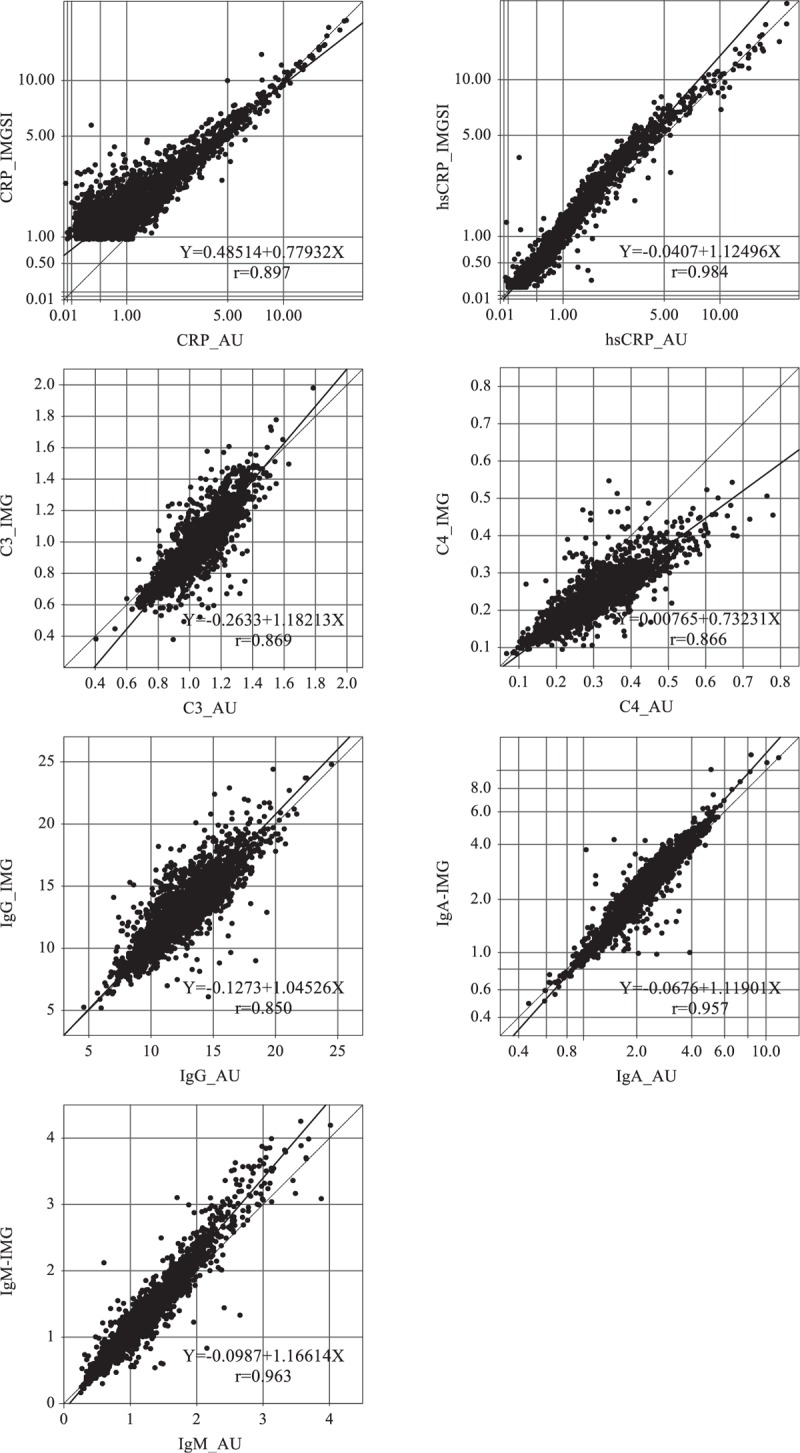
Comparison of results of specific proteins between the AU reagent and the IMMAGE reagent. The horizontal axis shows the measured results with the AU reagent and the vertical axis shows the results with the IMMAGE reagent.
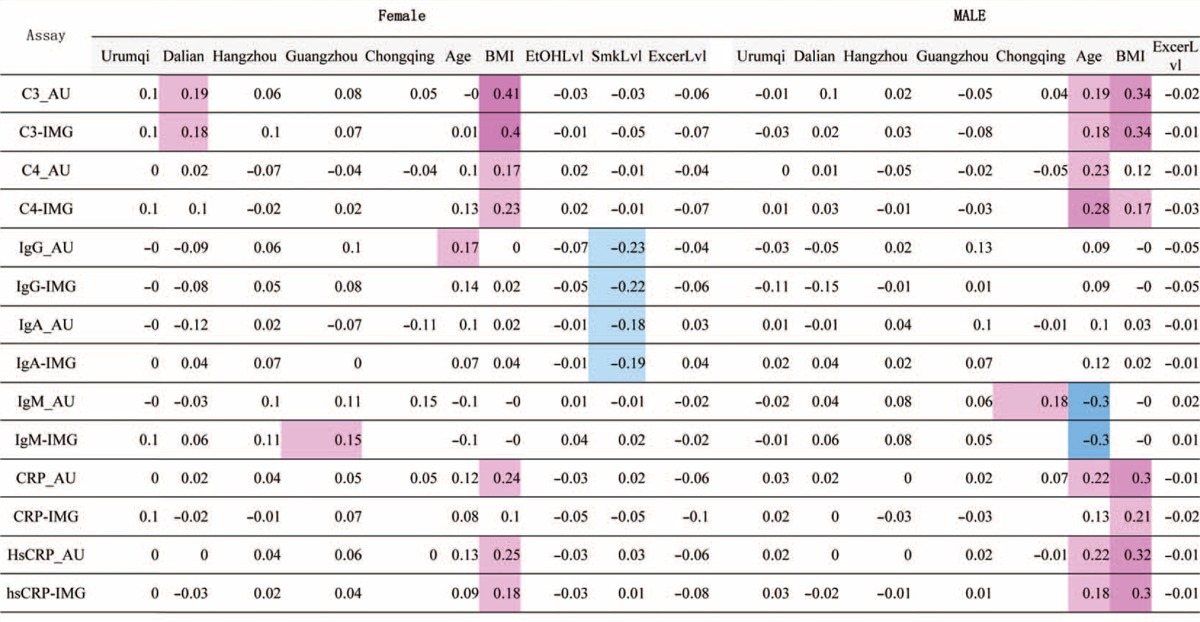
MRA results were listed in Table 3. From the magnitude of rp, the age-related changes were noted moderately for IgG, and C3, C4, CRP, hsCRP, IgM, in females. BMI-related changes in test results were noted as conspicuously high for C3, CRP, hsCRP in both genders, and moderately high for C4 in both genders. Smoking has a moderately negative effect on IgG and IgA in males. On the other hand, no notable changes in test results were associated with exercise levels in any analytes in both genders. No data was shown for the association of smoking status and alcohol consumption in females, due to very small proportion of female smokers and drinkers (<2% in this study).
TABLE 3.
MRA for Each Gender and Region With Age, BMI, Levels of Alcohol Consumption, Smoking, and Exercise as Explanatory Variables
Age-related changes of analytes were displayed by the scatter chart with trend line in Figure 1. IgG increased slowly after 50 years old in male participants. In female participants >45 years old, IgM decreased gradually, whereas C3, C4, CRP, and hsCRP increased gently. The trend lines of IgG and IgM in females were clearly higher than those in male. C3, CRP, and hsCRP have a cross point between the trend lines of females and males. In the lower age groups, the results of these analytes in males were higher than in females, whereas for participants >50 years old, the trend was reversed. There is no obvious discrepancy observed between genders in IgA.
FIGURE 1.
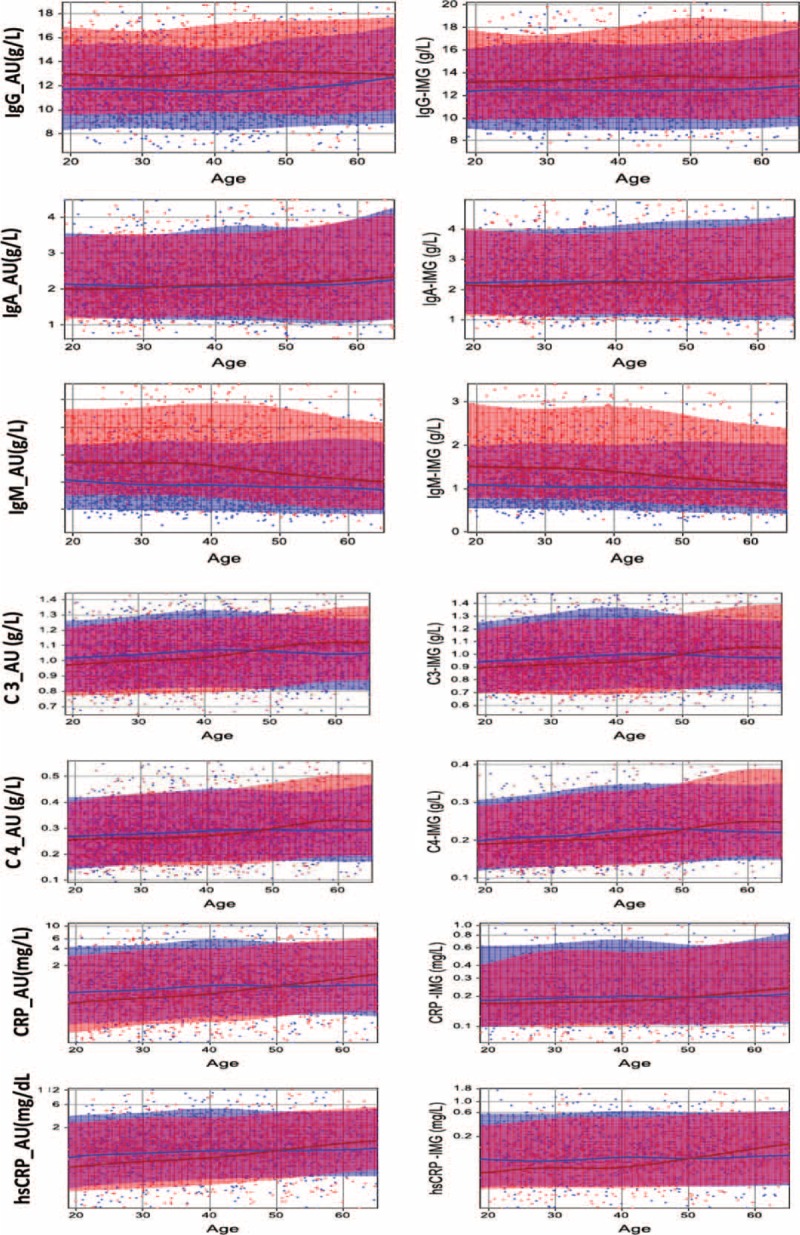
The scatter plots of age-related change in specific protein. The horizontal axis shows the change in the age and the vertical axis shows the assay results. The blue spots represent individual data of male and the blue solid line is the trend line of age-related change in male. Accordingly, the red spots and red solid line represent female data and trend line of female.
Reference intervals of specific proteins derived by parametric and nonparametric methods were listed in Table 4. Reference intervals of each analytes were classified by male (M) and female (F) and M+F. The secondary category based on the LAVE method was applied in 3 modes: (1) without the LAVE method; (2) allowing a single abnormal result in the analytes chosen for exclusion; (3) no abnormal result in the analytes. In general, reference intervals derived by a nonparametric method were wider than by a parametric method, yet the results of CRP and hsCRP were opposite. Serial changes in reference intervals during the iterative process of the LAVE method were listed in Table 4 for all the analytes. It is clearly shown that no change in the reference interval occurs by the LAVE method in most analytes, except for C3, C4, CRP, and hsCRP as those were BMI-related analytes. The reference intervals for IgG and IgM in female participants were clearly higher than in male participants, whereas in contrast, reference intervals of CRP and hsCRP in males were higher than in females. Reference intervals for C3 and C4 show no significant difference between genders.
TABLE 4.
Reference Intervals of Specific Protein Derived by Parametric and Non-Parametric Methods
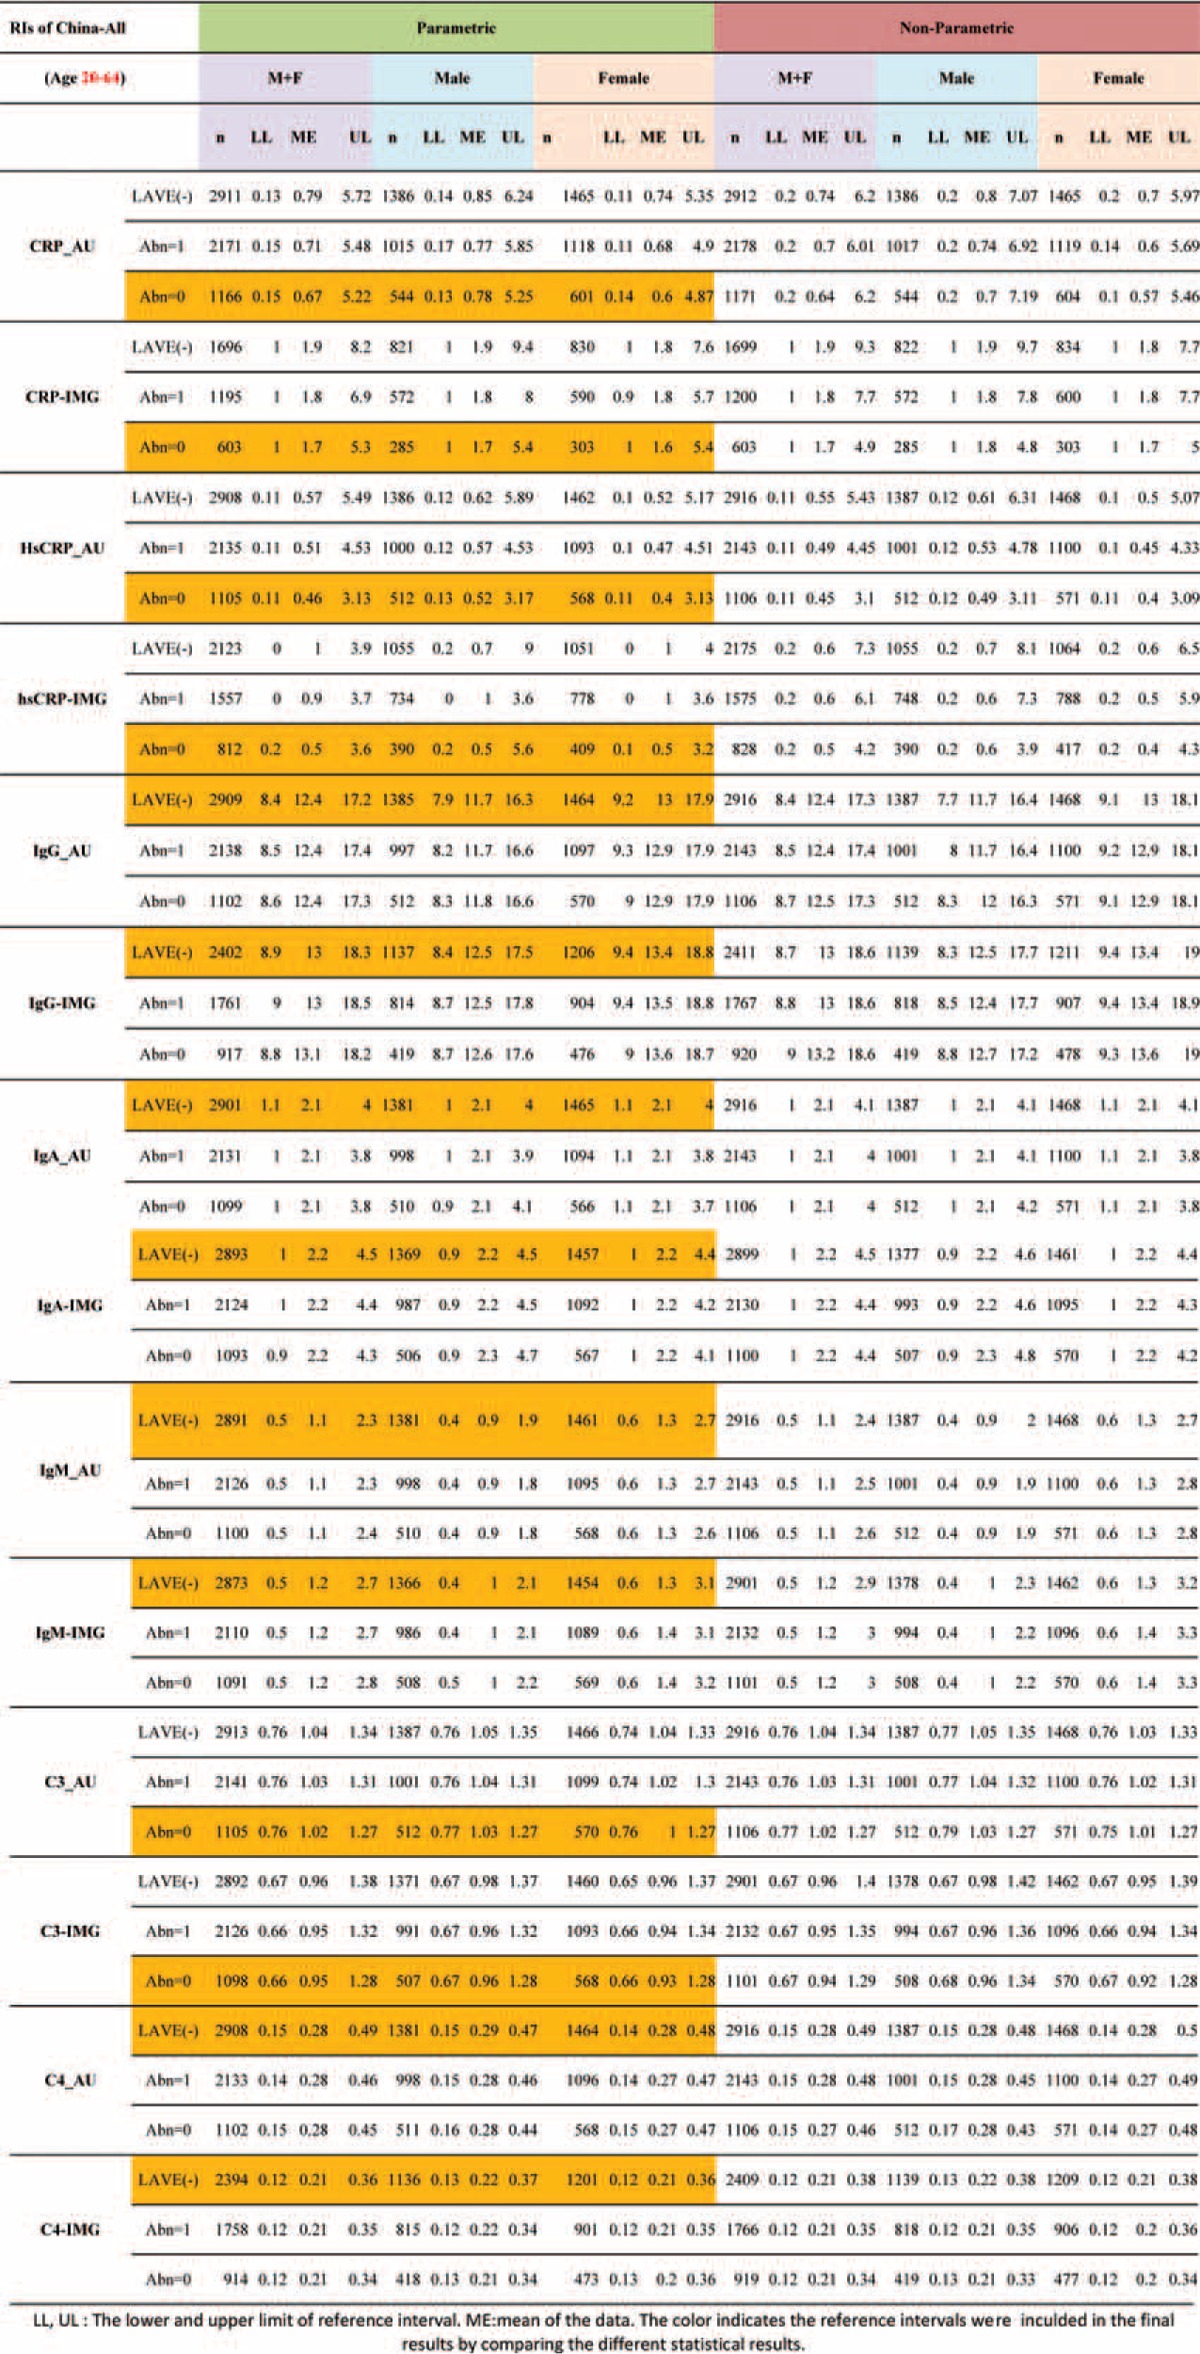
Figure 2 shows the comparison results of specific proteins between the AU and IMMAGE analytical systems. IgM_AU, IgA_AU, and hsCRP_AU had good correlation with IgM-IMG, IgA-IMG, and hsCRP-IMG, respectively (with a coefficient of correlation of fitted equation >0.95). Other analytes also had a favorable correlation between the AU and IMMAGE analytical systems with a coefficient of correlation of fitted equation >0.85. CRP_IMG and CRP_AU had lower coefficient of correlation(r); this was influenced by large proportional differences at low values (1–2 mg/L) and is likely an artifact of whole-number reporting for CRP_AU. The slope of C4 (0.73231 in Figure 2) was a little far away from the best fit one, so along with the increase of C4 value, the C4_IMG value dropped lower than the C4_AU value. IgG-IMG and IgG-AU unexpectedly had the lowest coefficient of correlation, which was due to the wide data distribution.
The comparison of panel test results from different countries was shown in Fig. 3. The assigned values and the measured values from China, Japan, and India were separately compared with different combinations. The results of assigned value were the average results on the Beckman Coulter AU system from several laboratories after they were calibrated by CRM 470. In each scatter plot of Figure 3, there were 2 diagonal lines, which were the linear fit line and reference line from the equation. If these 2 lines fit well, it means the values from horizontal and vertical axes are nearly equal. CRP and IgG belong to this condition, so the measured values from China, Japan, and India were considered to be accordant. Yet, a clear discrepancy of the linear fit line and reference line from the equation was observed in C4 from China and India compared with assigned values and other countries. The results of C4 from China were apparently higher than assigned values, whereas those from Indian were lower than assigned values. Therefore, the values of C4 measured from China and India were recalibrated using the regression line.
FIGURE 3.
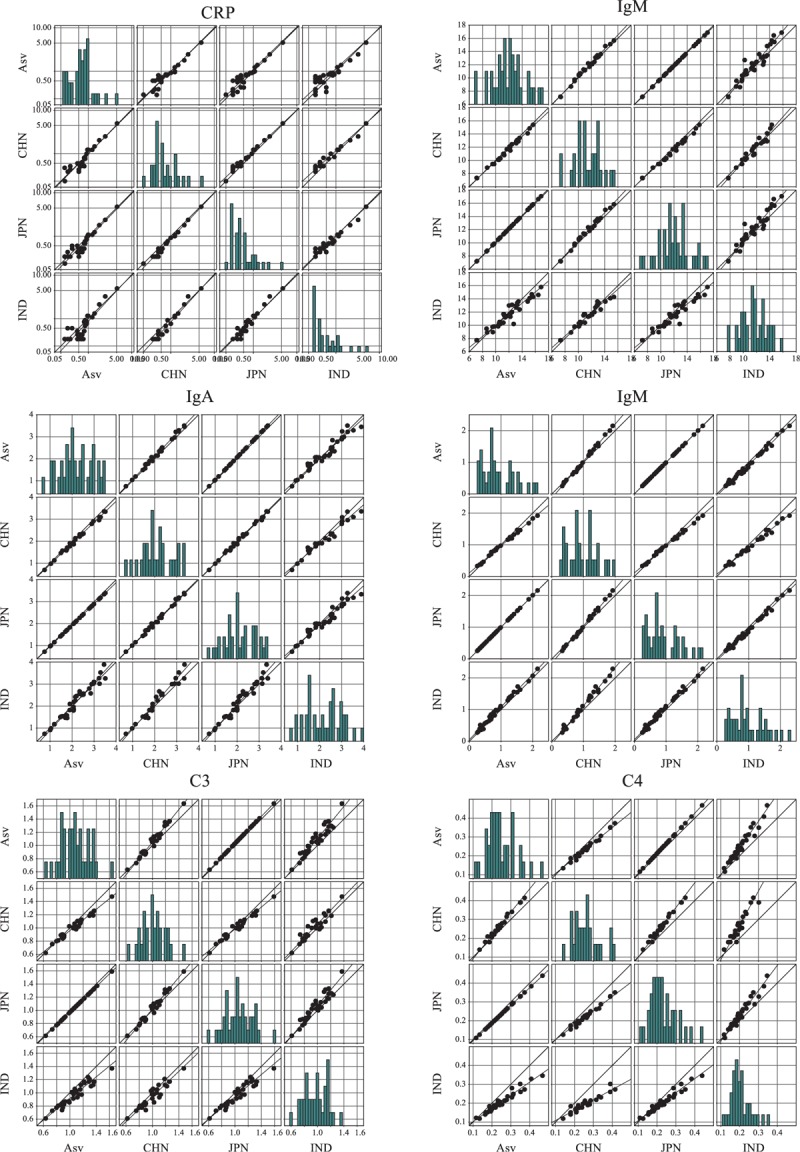
Comparison of panel test results from different countries. The first country (AsV) denotes assigned values for the panel. CHN, JFN, IND indicates China, Japan, and India. The 2 diagonal lines in each scatter plot are the linear fit line and the reference line from the equation. The bar charts show the frequency distribution along with increasing concentration. All values expressed in SI units.
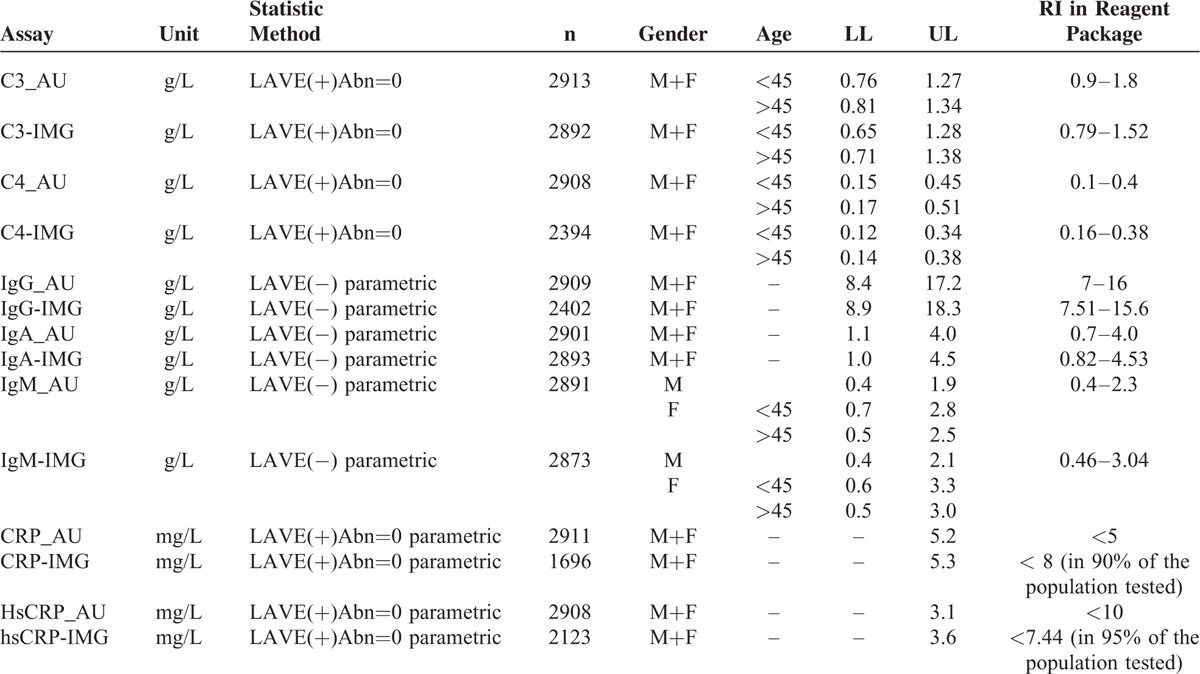
Table 5 details the final results of our study. Reference intervals of serum protein were divided by age, gender, and LAVE method to accurately distinguish the related influencing factors.
TABLE 5.
Reference Intervals of Specific Proteins
DISCUSSION
This is the first report summarizing nationwide research on reference intervals of specific proteins in China. Since the improvement of health condition and health consciousness, immunology-related disease such as immunoproliferative diseases, autoimmune disease, and subhealth has gotten more and more attention. Specific proteins are the routine screening tests for these diseases, yet the baseline research about these assays in general population is limited. Our research is a part of IFCC international reference interval study, and the strict and integrated protocols assure the accurate results output. We also added more exclusion criteria such as drug usage, night shift, and measured on 2 analytical platforms to get more reasonable information.
All the data from 6 cities were analyzed. Three-level ANOVA and MRA were used to distinguish the source of variances and partitioned the data for results presentation. Our data shows that differences in reference intervals for the 7 most commonly tested analytes were not observed regionally in China, yet differences from the gender and the age were found in IgG, IgM, C3, and C4. MRA indicate significant gender differences for IgG and IgM among the immune analytes in China. Scatter charts further confirm IgG and IgM in female participants were clearly higher than those in male participants. Age, BMI, smoking status, and exercise were included in the MRA to exclude the sources that could affect the gender difference in reference intervals. Smoking status has a negative effect on IgG and IgA in males. Similar to a previous study,8 smoking status is more significant than other factors associated with IgG. Therefore, in Table 5, IgG was not stratified by gender, whereas IgM was classified.
In females, there is an interesting change in scatter charts near the 45-year-old mark, where IgM reduced gradually, whereas C3, C4, CRP, and hsCRP increased gradually. This is caused by the perimenopause period affecting women near this age. Due to a decrease in hormone levels, a series of physical and mental changes affect women. There's no specific literature on the association between humoral immunity and the perimenopause period; however, several researchers have reported hormone deficiency in postmenopausal women may cause an impaired immune response, and estrogen replacement therapy can restore this phenomenon. Serum IgG, IgM, C3, and C4 levels were significantly higher in women receiving replacement therapy than in untreated women.11–13 These suggest that the low status of humoral immunity in postmenopausal women and changes of serum protein level may be caused by hormone reduction. To emphasize this point, the final results of our study is stratifies these assays by age group (>45 and <45). However, the change of CRP and hsCRP has no clinical importance, and they are not listed in the final data.
Consistent with previous reports, C3, CRP and hsCRP in both genders were related to BMI status (shown in Table 2).10,14 To eliminate the effect on these assays, LAVE methods were used to remove the abnormal values. This caused distinct changes in reference intervals between LAVE (−) and LAVE (+) abn=0. These confound factors should be recognized and analyzed by more scientific statistic methods. The confidence intervals (CIs) of reference intervals calculated by the parametric method were narrower than those calculated by the nonparametric approach, except for CRP and hsCRP.
Method comparison between the turbidimetry method on the AU5800 Clinical Chemistry System (Beckman Coulter; Brea, CA) and the nephelometry method on the IMMAGE 800 Immunochemistry System (Beckman Coulter; Brea, CA) is displayed in Figure 2. Similar research is unexpectedly rare. Several studies also point out good correlation between the turbidity method of C3, IgG, IgA, and IgM to corresponding nephelometry methods, yet C4 have a relatively unsatisfactory correlation.15,16 Denham16 gave an explanation of discordant C4 results as the fact that the frozen specimens may have micro clots, and the IMMAGE lacks a clot detection system. That may be 1 cause. Also, from comparison with assigned values and other countries’ serum panels (see Figure 3), the variation of C4 between different countries was more significant than with other serum protein. Although by recalculation of the results our study could provide harmonized or comparable results with other countries in this study, which could be used to further healthy status study. The harmonization of C4 still need more study. In Figure 2, the correlation coefficient of IgG is <0.9, which does not match with the previous report and our own study. The reasons have not been made clear, whether related with the reagents lot or the serum unknown interference.
When it comes to CRP and hsCRP, the nephelometric results were higher than the turbidimetric results consistent with the previous study.16–18 The authors argue that the cause may be method standardization and calibration. We observed a very interesting detail that on the Beckman Coulter AU system, CRP and hsCRP use the same reagent but different calibrators; yet on the IMMAGE system the calibrators are the same but reagents are different. Although CRP and hsCRP on these 2 platforms are all claimed to be traceable to the IFCC standard ERM-DA470, the various value-transfer protocol may cause the variability across assays.19 Furthermore, on the IMMAGE system, the hsCRP reagent contains particle-bound goat and particle-bound mouse anti-CRP antibodies, whereas the CRP reagent only has the goat polyclonal anti-CRP antibody. These all contribute to the differences of CRP and hsCRP between the 2 platforms and the 2 assays on the same platform.
In Table 5, reference intervals of specific proteins in our study are summarized. It is clear that our results are slightly different from the expected value in the manufacturer's package, but very close to the IFCC's previous study in China,8 although the latter was measured on a Beckman Coulter system. Notably the reference intervals of specific proteins were classified by gender, age, and using LAVE methods according to contributing factors. From Table 5 and Figure 2 we see the results of IgG_AU, IgM_AU, IgA_AU, and C3_AU aligning well with the results from the IMMAGE analytical system. So we recommend common reference intervals could be given for IgG, IgM, IgA, and C3 on the 2 platforms. C4, CRP, and hsCRP, however, still need a clear distinction between the AU analytical system and the IMMAGE analytical system. Reference intervals for C3 and C4 were narrower than a regional study in China,14 because the LAVE method applied in the analysis effectively excluded confounding factors like metabolic syndrome. As CRP and hsCRP had many out-of-range low values, it is impossible to provide the lower limits, and only the upper limits were listed in the final form.
Taken together, this study emphasizes the effect of age, gender, smoking status, BMI, and method type on reference intervals for serum proteins. Given the suggestions for accurate reference intervals of serum proteins on the most popular analytic systems in China and comparison the results of serum proteins between the nephelometric method and the turbidimetric method is the advantage of this study. The limitation of our study is that the age range and ethnic did not cover all the population in China. Children and several large ethnic populations, like Hui, Korea et al, were not included in our study. These need further study plan and data collection. In conclusion, this study provides a strict protocol on reference interval research and the reference intervals reported in this manuscript can be commonly used after evaluation in different laboratories in China.
Supplementary Material
ACKNOWLEDGMENTS
The authors received invaluable input from the IFCC C-RIDL. They are very grateful to Uludag University Central Laboratory. And they are also thankful to Shujun Yu and Jie Su from Beckman Coulter Inc. for their kind cooperation to realize this study.
Footnotes
Funding: this study was supported by the Research Fund of Uludag Universty (UAP (T)-2011/48), IFCC C-RIDL, the Scientific Research Fund (No: 24256003:2012–2014) provided by the Japan Society for the Promotion of Science, and Beckman Coulter Inc.
Employment or leadership: None declared.
Honorarium: None declared.
The authors have no conflicts of interest to disclose. Research funding played no role in the study design; in the collection, analysis, and interpretation of data; in the writing of the report; or in the decision to submit the report for publication.
REFERENCES
- 1.CLSI, C.A.L.S. Defining, establishing, and verifying reference intervals in the clinical laboratory; approved guideline. Defining, establishing, and verifying reference intervals in the clinical laboratory; approved guideline third edition. Third edition. CLSI document C28-A3. 2010. [Google Scholar]
- 2.Ye YF, W.Y.S.Z. National guide to Clinical Laboratory Procedures (third edition) [Chinese.]. Southeast University Press. Southeast University Press. 2006. [Google Scholar]
- 3.Jia K, Zhang C, Huang X, et al. Reference intervals of serum sodium, potassium, and chlorine in Chinese Han population and comparison of two ISE methods. J Clin Lab Anal 2015; 29:226–234. [DOI] [PMC free article] [PubMed] [Google Scholar]
- 4.Mu R, Chen W, Pan B, et al. First definition of reference intervals of liver function tests in China: a large-population-based multi-center study about healthy adults. PLoS One 2013; 8:e72916. [DOI] [PMC free article] [PubMed] [Google Scholar]
- 5.Wu X, Zhao M, Pan B, et al. Complete blood count reference intervals for healthy Han Chinese adults. PLoS One 2015; 10:e0119669. [DOI] [PMC free article] [PubMed] [Google Scholar]
- 6.Zegers I, Keller T, Schreiber W, et al. Characterization of the new serum protein reference material ERM-DA470k/IFCC: value assignment by immunoassay. Clin Chem 2010; 56:1880–1888. [DOI] [PubMed] [Google Scholar]
- 7.Ichihara K, Kawai T. Determination of reference intervals for 13 plasma proteins based on IFCC international reference preparation (CRM470) and NCCLS proposed guideline (C28-P,1992): trial to select reference individuals by results of screening tests and application of maximal likelihood method. J Clin Lab Anal 1996; 10:110–117. [DOI] [PubMed] [Google Scholar]
- 8.Ichihara K, Ceriotti F, Tam TH, et al. The Asian project for collaborative derivation of reference intervals: (1) strategy and major results of standardized analytes. Clin Chem Lab Med 2013; 51:1429–1442. [DOI] [PubMed] [Google Scholar]
- 9.Ricós C1, Alvarez V, Cava F, et al. Current databases on biological variation: pros, cons and progress. Scand J Clin Lab Invest 1999; 59:491–500. [DOI] [PubMed] [Google Scholar]
- 10.Ichihara K, Boyd JC. An appraisal of statistical procedures used in derivation of reference intervals. Clin Chem Lab Med 2010; 48:1537–1551. [DOI] [PubMed] [Google Scholar]
- 11.Kumru S, Godekmerdan A, Yilmaz B. Immune effects of surgical menopause and estrogen replacement therapy in peri-menopausal women. J Reprod Immunol 2004; 63:31–38. [DOI] [PubMed] [Google Scholar]
- 12.Yilmazer M, Fenkci V, Fenkci S, et al. Association of serum complement (C3, C4) and immunoglobulin (IgG, IgM) levels with hormone replacement therapy in healthy post-menopausal women. Hum Reprod 2003; 18:1531–1535. [DOI] [PubMed] [Google Scholar]
- 13.Liu Y, LV L. Effect of hormone replacement therapy on serum complement (C3, C4) and immunoglobulin (IgG, IgM) levels in post-menopausal women. J Huazhong Univ Sci Technolog Med Sci 2008; 28:102–103. [DOI] [PubMed] [Google Scholar]
- 14.Qin X, Lu Y, Yang X, et al. Determination of reference intervals for serum complement C3 and C4 levels in Chinese Han ethnic males. Clin Lab 2014; 60:775–781. [DOI] [PubMed] [Google Scholar]
- 15.Mali B, Armbruster D, Serediak E, et al. Comparison of immunoturbidimetric and immunonephelometric assays for specific proteins. Clin Biochem 2009; 42:1568–1571. [DOI] [PubMed] [Google Scholar]
- 16.Denham E, Mohn B, Tucker L, et al. Evaluation of immunoturbidimetric specific protein methods using the Architect ci8200: comparison with immunonephelometry. Ann Clin Biochem 2007; 44 (Pt 6):529–536. [DOI] [PubMed] [Google Scholar]
- 17.Jovicić S, Ignjatović S, Dajak M, et al. Analytical performance and clinical efficacy for cardiovascular risk estimation of an Olympus immunoturbidimetric high-sensitivity C-reactive protein assay. Clin Chem Lab Med 2006; 44:228–231. [DOI] [PubMed] [Google Scholar]
- 18.Maggiore U, Cristol JP, Canaud B, et al. Comparison of 3 automated assays for C-reactive protein in end-stage renal disease: clinical and epidemiological implications. J Lab Clin Med 2005; 145:305–308. [DOI] [PubMed] [Google Scholar]
- 19.Kimberly MM1, Vesper HW, Caudill SP, et al. Standardization of immunoassays for measurement of high-sensitivity C-reactive protein. Phase I: evaluation of secondary reference materials. Clin Chem 2003; 49:611–616. [DOI] [PubMed] [Google Scholar]
Associated Data
This section collects any data citations, data availability statements, or supplementary materials included in this article.


