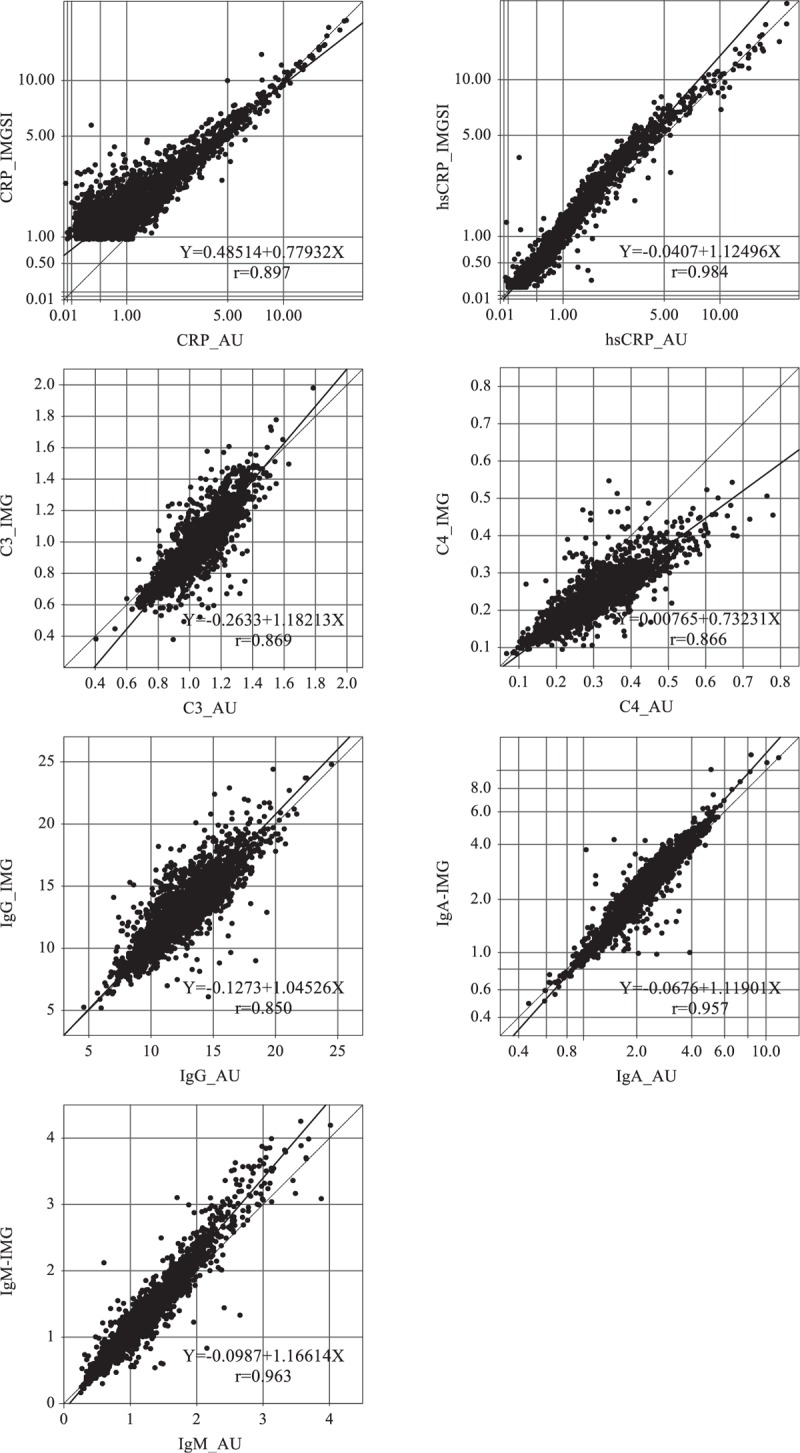
FIGURE 2.

Comparison of results of specific proteins between the AU reagent and the IMMAGE reagent. The horizontal axis shows the measured results with the AU reagent and the vertical axis shows the results with the IMMAGE reagent.

Comparison of results of specific proteins between the AU reagent and the IMMAGE reagent. The horizontal axis shows the measured results with the AU reagent and the vertical axis shows the results with the IMMAGE reagent.