
FIGURE 3.
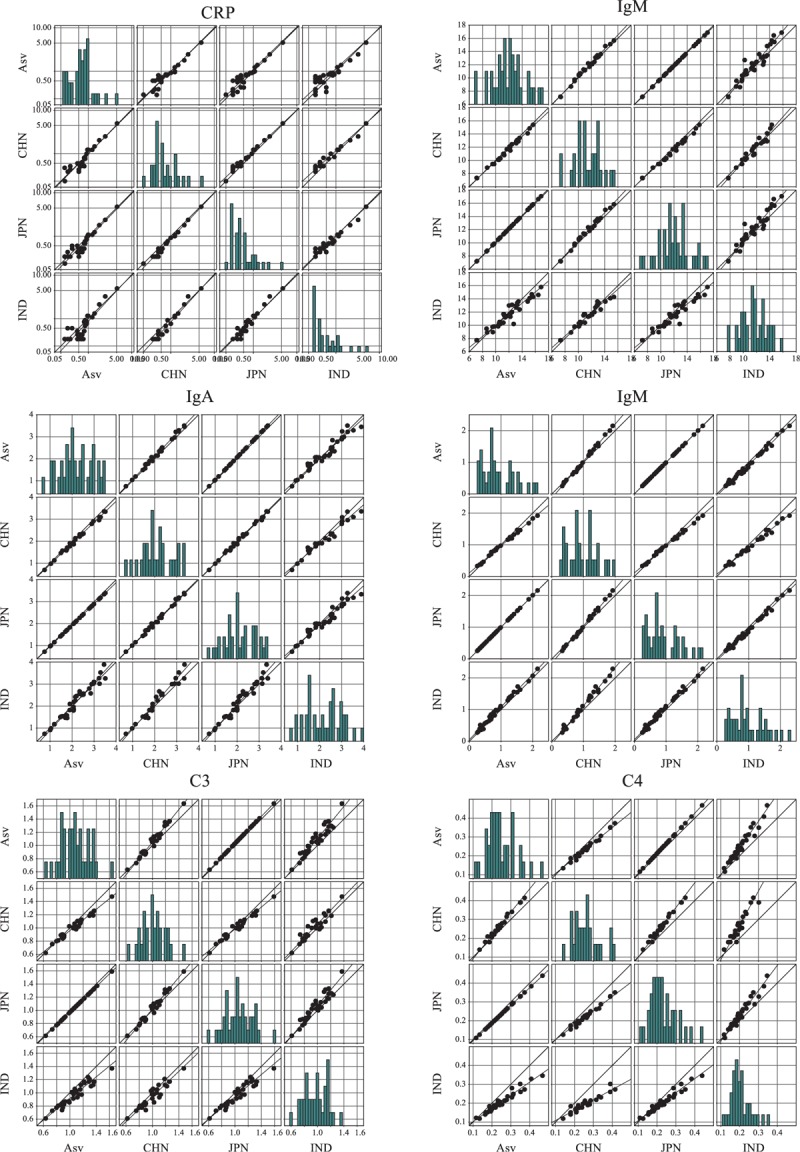
Comparison of panel test results from different countries. The first country (AsV) denotes assigned values for the panel. CHN, JFN, IND indicates China, Japan, and India. The 2 diagonal lines in each scatter plot are the linear fit line and the reference line from the equation. The bar charts show the frequency distribution along with increasing concentration. All values expressed in SI units.