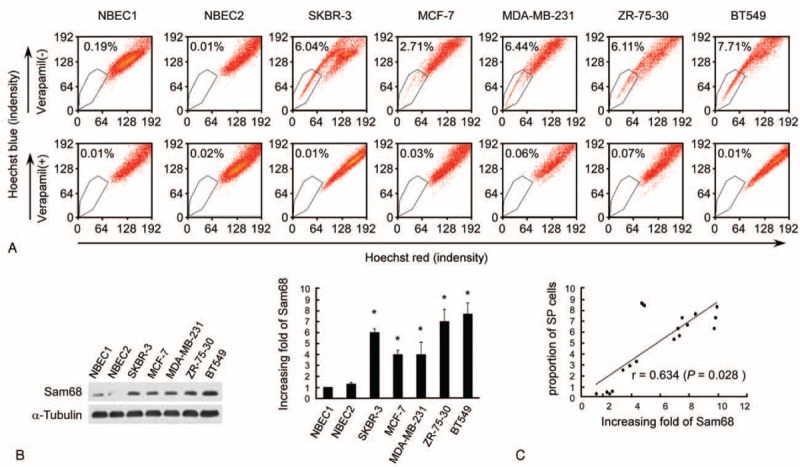
FIGURE 1.

Enhanced expression of Sam68 positively correlates with the stem cell phenotype in breast cancer cell lines. (A) Assessment of the proportion of side population (SP) cells in cancer and noncancer breast cell lines using Hoechst 33342 staining and flow cytometry. Verapamil-treated cells were used as negative controls (lower). Each cell line was assessed in triplicate and the average value is shown in the upper left corner of each plot. (B) Western blot of Sam68 protein expression in breast cell lines (left); α-tubulin was used as a loading control. The fold changes in Sam68 expression relative to the expression of NBEC1were analyzed by densitometry; each cell line was assessed in triplicate and the mean ± SD values are shown (right). ∗P < 0.05 vs. NBEC1, name tested. (C) Correlation between the protein level of Sam68 protein and the proportion of SP cells in breast cancer cells by Student t test. Each cell line had three dots as each experiment was repeated 3 times.
