Figure 1.

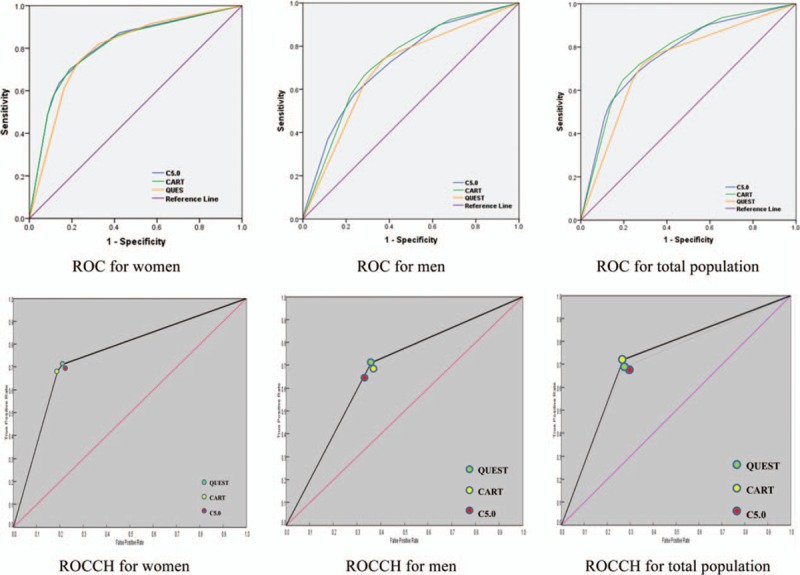
ROC curves and ROCCH for the 3 classifiers on 3 testing datasets, Tehran Lipid and Glucose Study (1999–2012). ROC = receiver operating characteristics, ROCCH = ROC Convex Hull.

ROC curves and ROCCH for the 3 classifiers on 3 testing datasets, Tehran Lipid and Glucose Study (1999–2012). ROC = receiver operating characteristics, ROCCH = ROC Convex Hull.