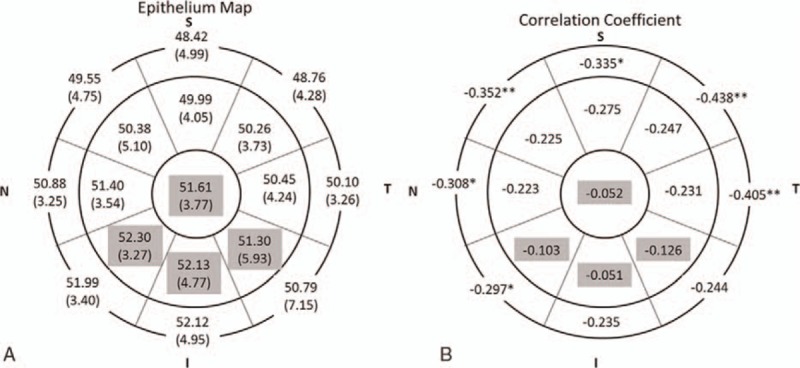
Figure 7.

Distribution of corneal epithelial thickness (CET) (μm) and correlation with age. A, Mean (SD) CET in 17 sectors. B, Correlation coefficient in 17 sectors. Gray region indicates no significant correlation with age and the white region indicates negative linear correlation (Spearman test, P <0.05; ∗P <0.01; ∗∗P <0.001).
