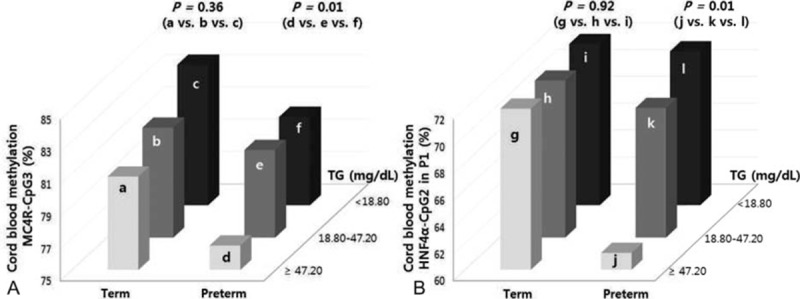
Figure 3.

DNA methylation status by TG group of MC4R-CpG3 (A) and HNF4α-CpG2 (B) in the P1 promoter in cord blood cells from term and preterm infants. Preterm infants in the high-TG group show the lowest methylation levels of MC4R-CpG3 and HNF4α-CpG2 in the P1 promoter. P values were calculated using the Bonferroni post-hoc test. a: High-TG group of term infants in A, b: mid-TG group of term infants in A, c: low-TG group of term infants in A, d: high-TG group of preterm infants in A, e: mid-TG group of preterm infants in A, f: low-TG group of preterm infants in A, g: high-TG group of term infants in B, h: mid-TG group of term infants in B, i: low-TG group of term infants in B, j: high-TG group of preterm infants in B, k: mid-TG group of preterm infants in B, and l: low-TG group of preterm infants in B. MC4R = melanocortin 4 receptor, HNF4α = hepatocyte nuclear factor 4 alpha, TG = triglyceride.
