
Figure 3.
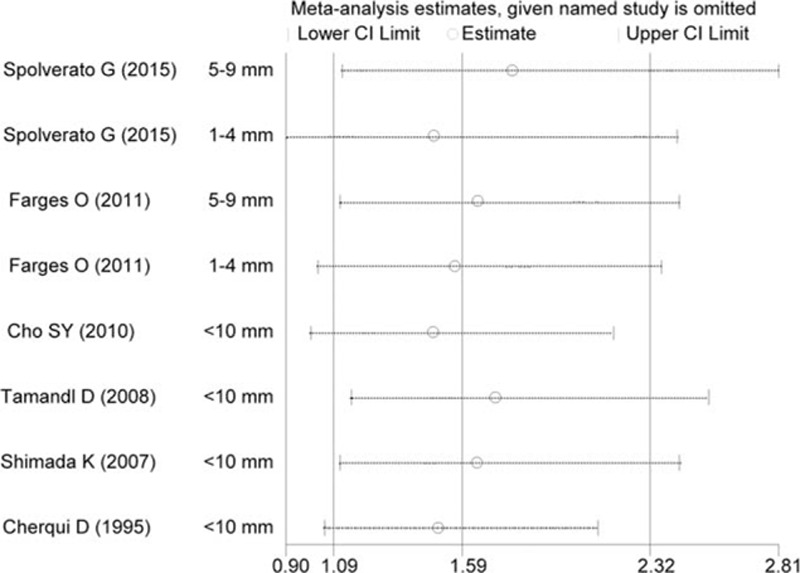
Results of the sensitivity analysis. The middle vertical line indicates the combined HR, and the 2 vertical lines represent the corresponding 95% CI values. The middle small circle and the 2 ends of the dotted lines indicate the pooled HR and 95% CI values, respectively, when the study on the left was omitted after each round of analysis. CI = confidence interval, HR = hazard ratio.