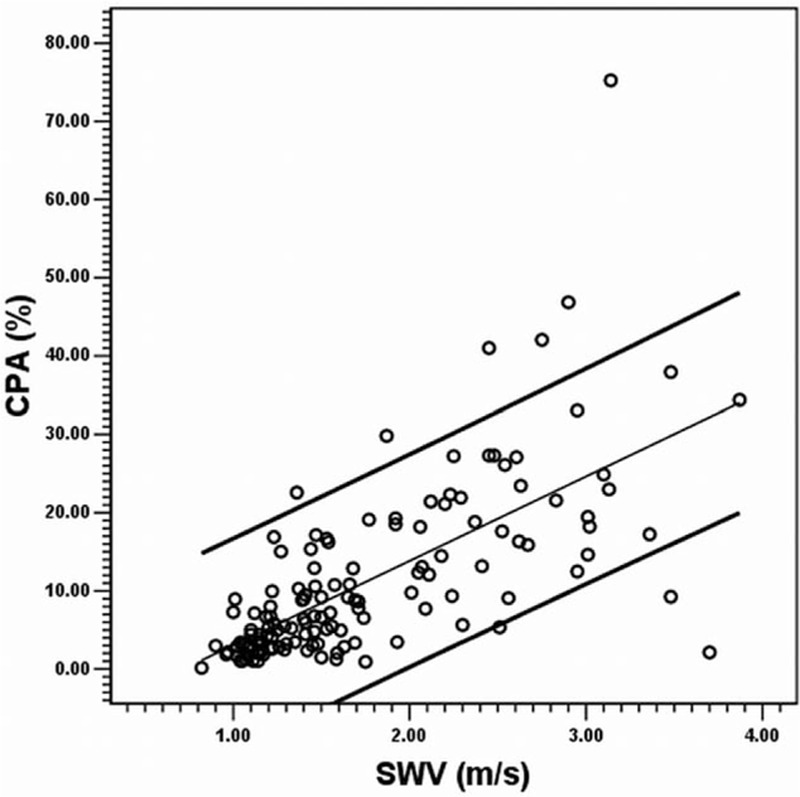
Figure 2.

Scatter plot between the collagen proportionate area (y axis) and shear wave velocity (x axis) in the CHB group (n = 137). The CPA was predicted using SWV alone through univariate linear regression as a line of best fit (R2 = 0.459, P < 0.001) by using the formula: CPA (%) = −7.741 + SWV (m/s) × 10.793. Eight of the 137 cases (5.8%) exceeded the 95% confidence intervals. CHB = chronic hepatitis B, CPA = collagen proportionate area, SWV = shear wave velocity.
