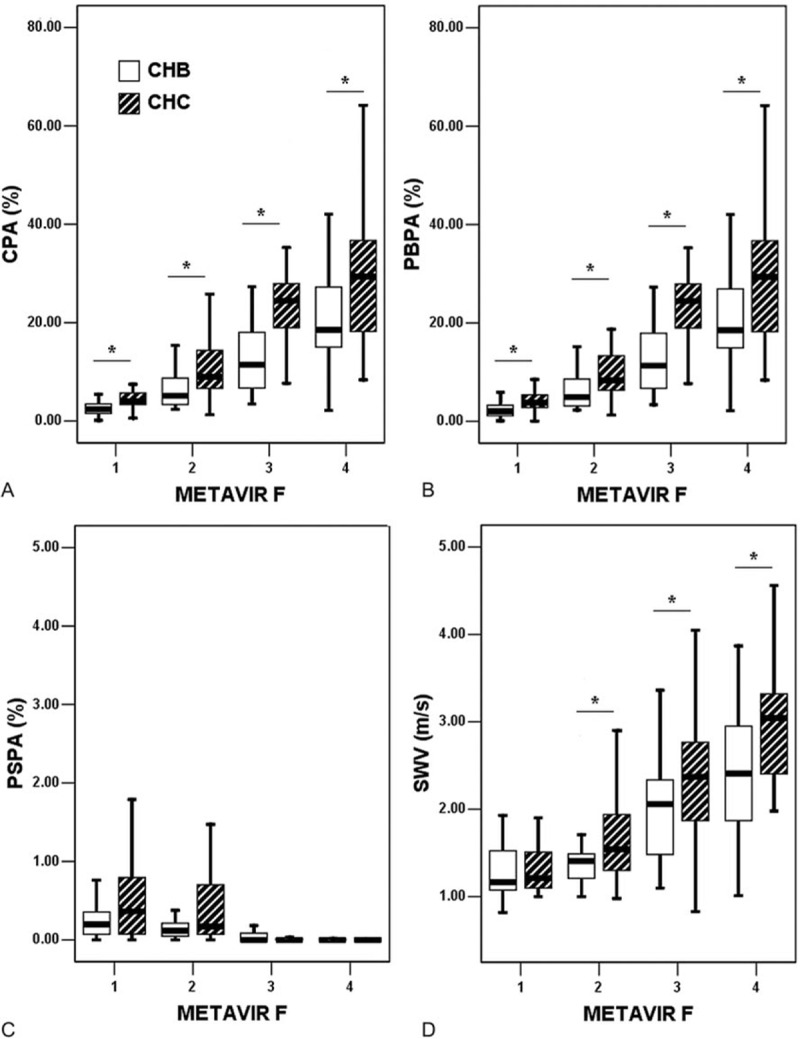
Figure 3.

Box plots of the collagen proportionate areas (%) and shear wave velocity (m/s). Note that 36 (26.3%), 36 (26.3%), 28 (20.4%), and 37 (27.0%) cases in the CHB group and 34 (24.8%), 45 (32.9%), 34 (24.8%), and 24 (17.5%) cases in the CHC group were staged as F1, F2, F3, and F4, respectively. An asterisk indicates P < 0.05. CHB = chronic hepatitis B, CHC = chronic hepatitis C, CPA = collagen proportionate area, F = METAVIR fibrosis stage, PBPA = portal–bridging collagen proportionate area, PSPA = perisinusoidal collagen proportionate area, SWV = shear wave velocity.
