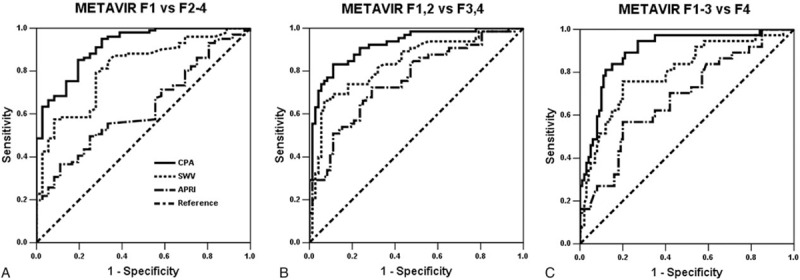
Figure 4.

Receiver operating characteristic curves dichotomizing liver fibrosis stages in the CHB group (n = 137). To dichotomize (A) F1 versus F2 to F4, the areas under a receiver operating characteristic curve for the CPA was 0.914 (95% confidence interval: 0.864–0.965) and SWV was 0.810 (0.732–0.888) (CPA vs SWV, P = 0.029). For (B) F1 and F2 versus F3 and F4, the CPA was 0.921 (0.877–0.966) and the SWV was 0.836 (0.767–0.905) (P = 0.042). For (C) F1 to F3 versus F4, the CPA was 0.899 (0.840–0.958) and the SWV was 0.799 (0.712–0.886) (P = 0.060). APRI = aspartate transaminase-to-platelet ratio index, CHB = chronic hepatitis B, CPA = collagen proportionate area, F = METAVIR fibrosis stage, SWV = shear wave velocity.
