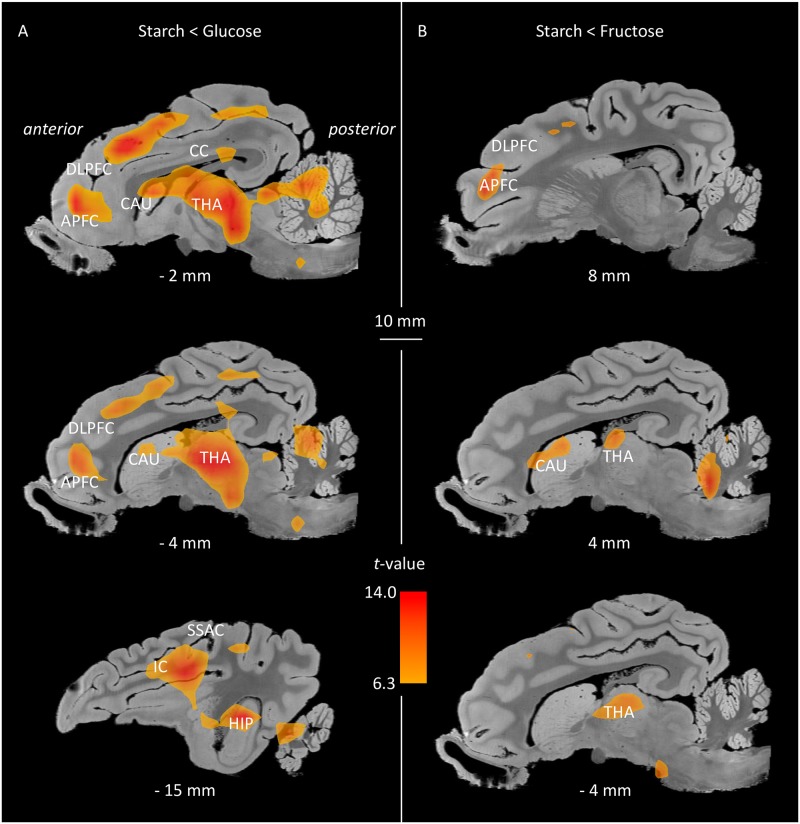
Fig 1. Brain metabolic differences between starch and glucose groups and starch and fructose groups.
There was no statistical difference between glucose and fructose groups. Sagittal slices showing some brain structures identified during the whole-brain analyses (Punc < 0.001; Threshold T = 6.3). (A) Starch group less activated than glucose group, Starch < Glucose (in red); and (B) Starch group less activated than fructose group, Starch < Fructose (in yellow). APFC, anterior prefrontal cortex; DLPFC, dorsolateral prefrontal cortex; IC, insular cortex; CC, cingulate cortex; SSAC, somatosensory association cortex; HIP, hippocampus; THA, thalamus; CAU, caudate nucleus. The x coordinates in the CA-CP (commissura anterior-commissura posterior) plane are indicated below the images.

