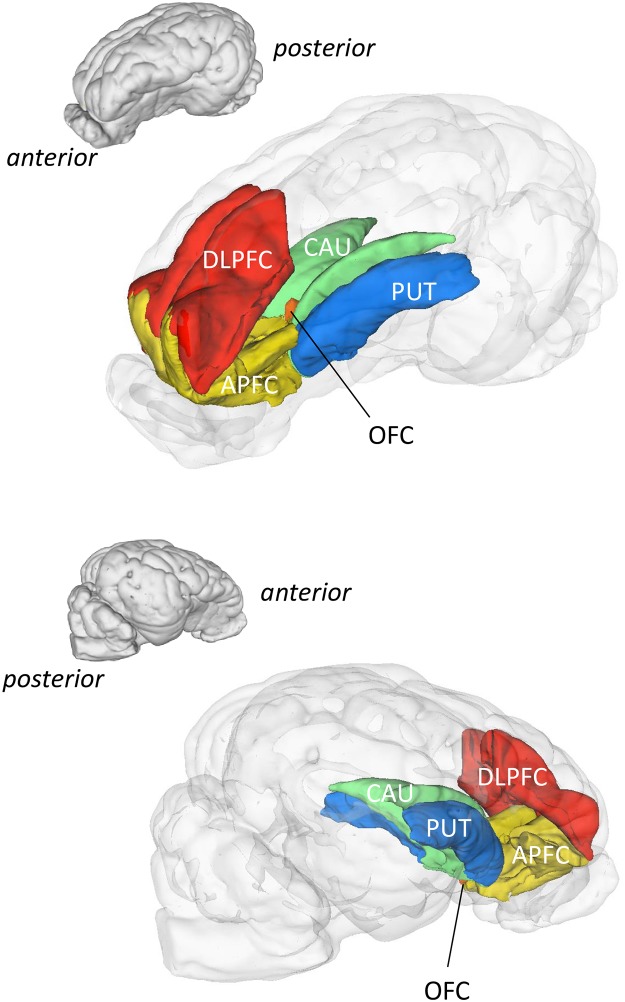
Fig 2. Recap three-dimensional brain models showing the regions of interest (ROI) activated by chronic consumption of sugar-enriched diets.
3D-representations of the ROI that were significantly activated by both glucose and fructose compared to starch group (Starch < Glucose and Starch < Fructose), using the SPM8 (statistical parametric mapping) small volume correction (SVC) analysis (Punc < 0.001; Threshold T = 6.3). APFC, anterior prefrontal cortex; DLPFC, dorsolateral prefrontal cortex; OFC, orbitofrontal cortex; CAU, caudate nucleus; PUT, putamen. There was no statistical difference between glucose and fructose groups.

