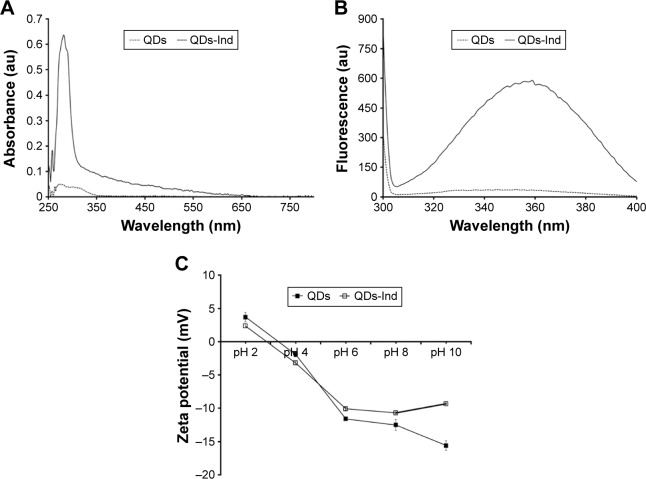
Figure 1.
(A) UV/vis spectra of QDs and QDs-Ind, by assessing the absorbance of tryptophan residues; (B) fluorescence spectra of QDs and QDs-Ind, mean ± SD; and (C) ZP of QDs and QDs-Ind at different pHs. Data are mean ± SD.
Abbreviations: QDs, quantum dots; ZP, zeta potential; QDS-Ind, quantum dots-indolicidin.

