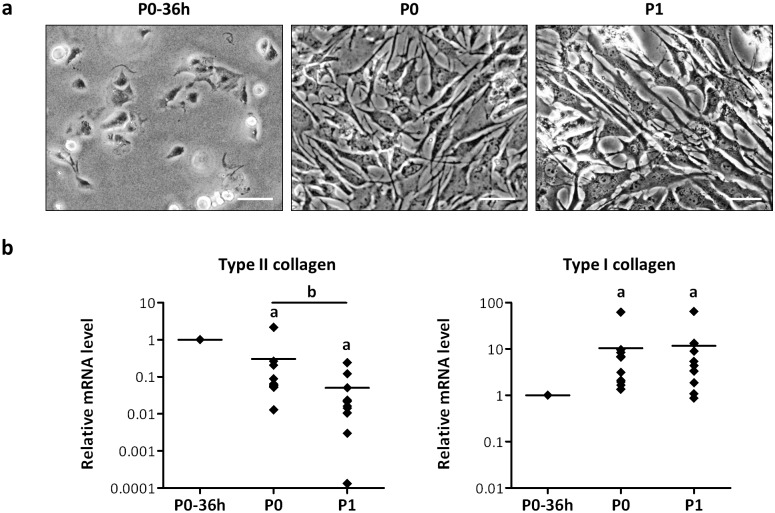
Fig 2. HACs undergo dedifferentiation during the amplification phase.
(a) Representative phase-contrast micrographs showing changes in cell morphology during HAC expansion in monolayer (scale bars 50 μm). (b) Transcriptional levels of type I and type II collagen measured by Real-time PCR. Data were normalized on GAPDH using the 2-ΔCt method, expressed relatively to data obtained for P0 HACs36 hours after isolation (P0-36h, reference value = 1) and reported as single data points with mean in the dot plots (n = 10, a: p < 0.05, significant effects versus P0-36h HACs; b: p < 0.05, significant effect versus P0 HACs).

