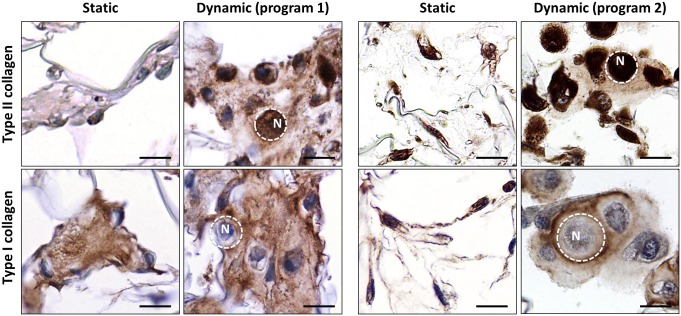
Fig 5. Cellular localization of type II and type I collagen after culture in static or dynamic conditions.
Representative high magnification observations of HACs cultured for 21 days in static or dynamic conditions using either program 1 (n = 4) or program 2 (n = 6) in the presence of BIT (scale bars 10 μm). N: nucleus. The dotted lines indicate the cell border.

