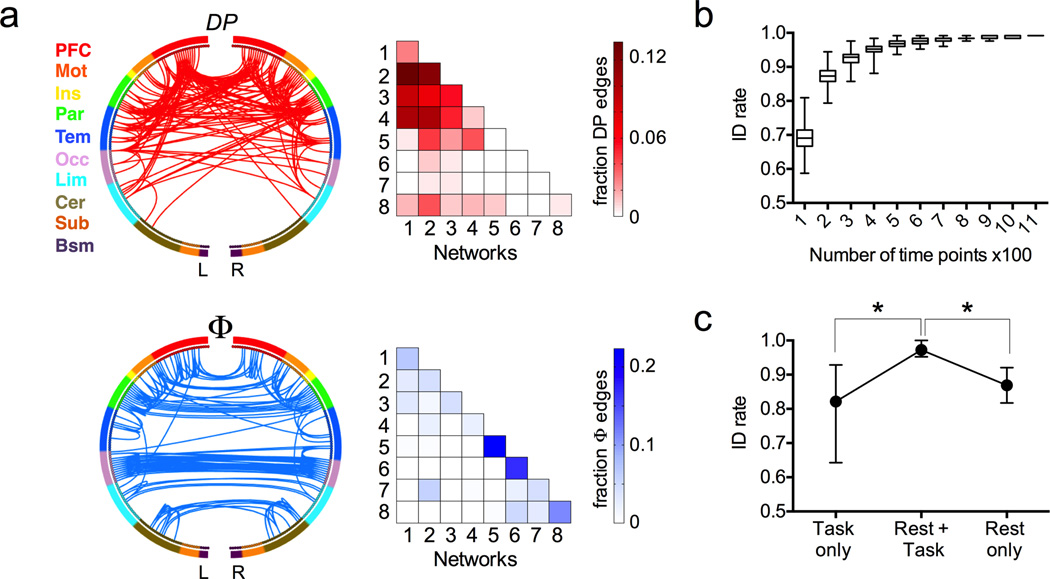
Figure 3. Factors affecting identification accuracy.
a) Highly unique (DP, top row, red) and highly consistent (Φ, bottom row, blue) edges in individual connectivity profiles. For visualization, both sets of edges were thresholded at the 99.5 percentile. In the circle plots (left), the 268 nodes (inner circle) are organized into a lobe scheme (outer circle) roughly reflecting brain anatomy from anterior (top of circle) to posterior (bottom of circle), and split into left and right hemispheres; lines indicate edges. In the colored matrices (right), the same data are plotted as percentage of edges within and between each pair of networks; a darkly shaded cell indicates a relative over-representation of that network pair in the DP (top) or Φ (bottom) masks. PFC, prefrontal; Mot, motor; Ins, insula; Par, parietal; Tem, temporal; Occ, occipital; Lim, limbic (including cingulate cortex, amygdala and hippocampus); Cer, cerebellum; Sub, subcortical (including thalamus and striatum); Bsm, brainstem; L, left hemisphere; R, right hemisphere. b) Longer timeseries improve identification accuracy. To control for the fact that task sessions contained fewer time points than rest sessions, we recalculated rest connectivity matrices using truncated timeseries containing between 100 and 1,100 time points. Results shown are from 500 randomizations using Rest1 and Rest2 as the database and target sessions, respectively. Box represents median with 25 and 75th percentiles; whiskers represent range. c) Use of a two-matrix database improves identification rate relative to a single matrix (task or rest). Dots and error bars represent mean and range of identification rate across all possible database and target pairs, where the target matrix was always from a task session and the database consisted of a rest-task pair (n = 8 combinations), task only (n = 8) or rest only (n = 4). *p < 0.01, Mann Whitney U test.

