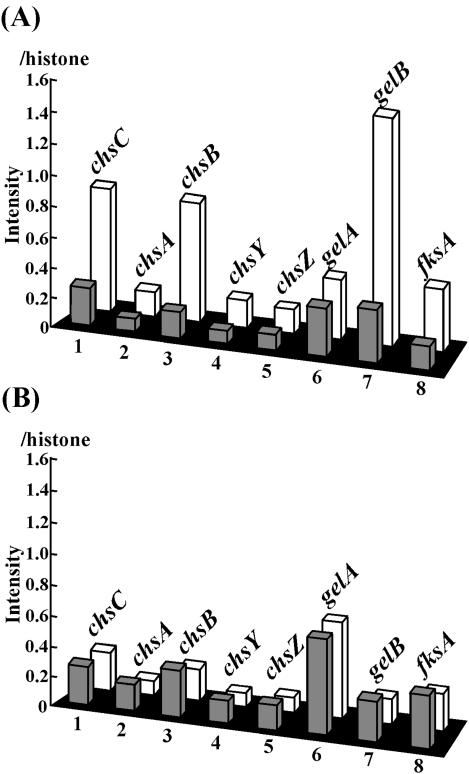
FIG. 4.
Expression levels of genes involved in cell wall biogenesis. The bar graphs indicate the expression levels of the genes encoding cell wall synthesis-related proteins from wild-type and ΔkexB strains grown on CD agar plates (A) and CD agar plates containing 0.8 M NaCl (B). The gray and white bars indicate the relative intensities of transcription of the genes in the wild-type and ΔkexB strains, respectively, on the basis of the cDNA microarray analyses. The relative intensities of the examined genes were calculated using the intensity of histone H2B as an internal standard (1.0). The genes were as follows: 1, chsC (chitin synthase C) (50); 2, chsA (chitin synthase A) (our unpublished data; DDBJ/ENBL/GenBank accession no. BAB85683); 3, chsB (chitin synthase B) (51); 4, chsY (chitin synthase Y) (9); 5, chsZ (chitin synthase Z) (9); 6, gelA (glycosylphosphatidylinositol-anchored glucanosyltransferase) (48); 7, gelB (glycosylphosphatidylinositol-anchored glycanosyltransferases) (48); and 8, fksA [β(1-3) glucan synthesis] (34).

